Full research appendix · corrected version 2. This is the frozen detail record behind the article. The source's local capture remains private; linked CSVs preserve the public result values and types. Evidence guide.
Arc trading on 16 September
160.12 million USDC traded; the launchpad picture is still incomplete
Measured window: 06:19:10–14:00 UTC · 11:49:10–19:30 IST · 7 hours, 40 minutes, 50 seconds. Local research snapshot, version 2. Post-move values and buyer-count scope corrected; the data window and headline are unchanged. Revision audit.
Arc’s token markets recorded 160.12 million USDC of quote turnover in the saved window. Across the wider DEX record set, 62,369 trader addresses made 1,543,945 pool executions in 1,316,577 transactions. Activity was broad enough to involve thousands of markets, yet much of the turnover came from a small share of addresses. The top address alone accounted for 8.79% of the wider USDC-quoted total.
Among the named launch sources with mapped tokens, Minara led with 26.63 million USDC. Its largest token supplied half that sum. An unnamed factory at 0xb021…97da had 50.63 million USDC, while 74.55 million USDC could not be linked to our saved launch registry. Those two groups prevent a defensible chain-wide ranking of launchpad brands.
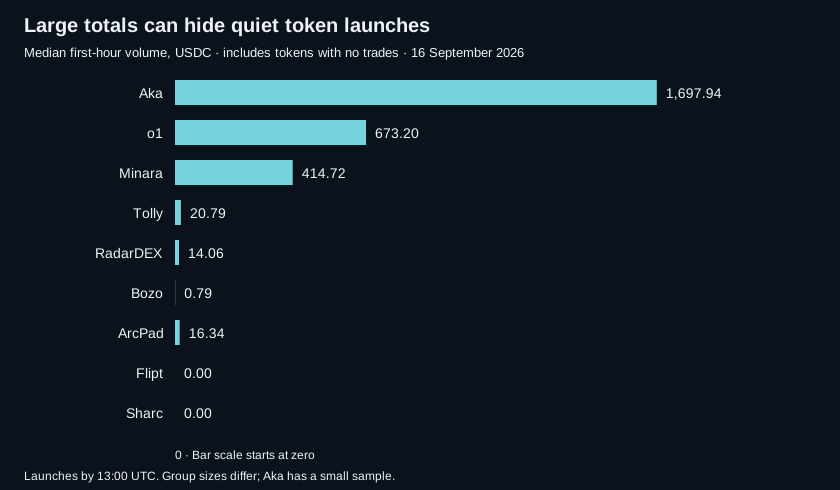
The median token often told a less lively story than the total. Minara’s eligible new tokens had median first-hour turnover of 414.72 USDC. Tolly’s median was 20.79 USDC; RadarDEX’s was 14.06 USDC. These are observed DEX results for the mapped token sets. Missing curve trades, older tokens and contract versions limit comparisons.
Confidence: high in the saved counts and arithmetic; moderate in the named token-set comparisons; unknown for full launchpad market shares, trader profit and net capital entering Arc.
Read the window correctly
Circle’s Arc blockchain was scheduled for public mainnet launch on 16 September, after an earlier private mainnet phase. The official event’s pre-show starts at 15:30 UTC and its mainstage at 18:00 UTC, both after this snapshot’s cutoff. The first retained record is therefore a data boundary. It does not establish the time Arc became public. Arc announcement, launch-event schedule.
Trading measures use Bitquery’s Trading.Trades cube. Raw chain records supply block, transaction, launch, fee and transfer checks. The headline’s 160.12 million USDC excludes 2,709 records worth 213,615.85 USDC exchanging native USDC and its ERC-20 view. The wider captured total is 160.34 million USDC. Tables below use that wider total unless marked otherwise, so they reconcile to the full saved cube. The difference is 0.13%.
The token-market headline covers 1,482,907 USDC-quoted executions and 62,266 addresses. Other quote assets and the separate same-USDC set remain in the wider counts. Dollar signs are avoided for USDC quantities; reference-USD estimates are kept separate. Headline calculation, full cube totals, same-USDC set.
1. Activity rose, then eased in the final hour
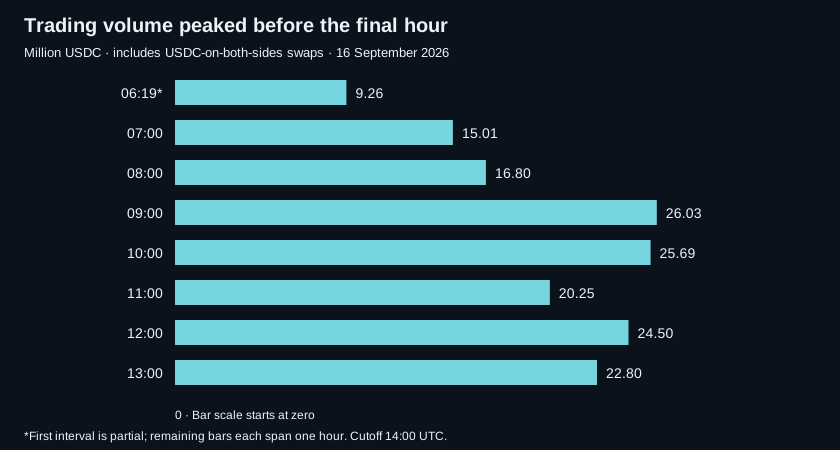
The busiest complete hour for USDC turnover was 09:00–10:00 UTC, at 26.03 million. The following hour had the most pool executions, 249,613, despite slightly less turnover. This is one reason trade count and traded value need separate views.
From 12:00–13:00 to 13:00–14:00 UTC, turnover fell 6.94%, from 24.50 million to 22.80 million USDC. Pool executions fell 16.50%, while active trader addresses barely changed: 24,560 to 24,458, down 0.42%. Fewer executions per address and a larger mean execution size describe the last hour better than an exodus of traders.
The exact address-level split explains the 1.70 million decline:
- The 12,265 addresses present in both hours reduced turnover by 1.385 million USDC.
- Addresses seen only in the later hour contributed 5.147 million USDC.
- Addresses seen only in the earlier hour had contributed 5.462 million USDC.
“Later hour only” says nothing about whether an address was new to Arc. It means absent from the comparison hour. These changes are accounting facts; they do not show why a trader acted. Hourly values, change split.
| UTC start | Executions | Trader addresses | USDC turnover |
|---|---|---|---|
| 06:00 * | 99,584 | 11,694 | 9,259,388.47 |
| 07:00 | 160,100 | 16,487 | 15,011,435.86 |
| 08:00 | 166,511 | 17,742 | 16,796,555.37 |
| 09:00 | 242,861 | 20,900 | 26,028,866.25 |
| 10:00 | 249,613 | 22,146 | 25,693,462.02 |
| 11:00 | 187,411 | 20,583 | 20,248,897.90 |
| 12:00 | 238,623 | 24,560 | 24,498,548.66 |
| 13:00 | 199,242 | 24,458 | 22,798,663.16 |
The first interval starts at 06:19:10, not 06:00. All later rows span one full hour.
Most executions were small
For the wider USDC-quoted set, median size was 36.60 USDC, against a mean of 107.93. The 90th percentile was 232.87, and the 99th was 1,026.05. 27.62% of executions were below 10 USDC but supplied only 1.16% of turnover. Trades from 100 to 1,000 USDC supplied 54.70% of turnover.
There were 154,638 transactions with several pool executions, or 11.75% of trading transactions. One transaction contained 50. Summing pool turnover counts each execution in a route; it does not reconstruct the amount a trader exchanged once across that whole route. Trade-size distribution, routing counts.
2. V4 dominated execution; token names do not prove identity
| Execution protocol | Pool executions | USDC turnover | Share |
|---|---|---|---|
| uniswap v4 | 1,265,968 | 120,553,057.20 | 75.19% |
| uniswap v3 | 254,873 | 36,682,099.76 | 22.88% |
| uniswap v2 | 22,929 | 3,080,892.79 | 1.92% |
| aerodrome v1 | 175 | 19,767.94 | 0.01% |
Uniswap V4-style records supplied 75.19% of the wider USDC turnover and 82.00% of executions. The protocol label identifies the execution format. It does not establish which website a trader used or who ran the launch.
The cube covered 16,097 pool identifiers and 14,450 base-token identifiers. A base-token count omits assets appearing only as a quote and can include the native-USDC identifier. It is not a count of newly issued tokens. The top five base-token groups accounted for 26.41% of USDC turnover. Protocol results, token results.
| Token address | Reported symbol | USDC turnover | Trader addresses |
|---|---|---|---|
| 0xa163d7…861bb | Minara | 13,542,321.91 | 8,143 |
| 0xece5ca…2cb3c | ARGUS | 12,734,010.69 | 8,082 |
| 0x8e98a6…8f9d9 | USDC | 6,066,095.83 | 2,841 |
| 0x2ba0f4…b043b | CRCL | 5,517,210.63 | 4,224 |
| 0xbc43ce…90b67 | TOLLY | 4,486,946.34 | 3,863 |
| 0x30ac39…4c84a | PI | 4,144,471.21 | 3,801 |
| 0x8b903a…b9e3c | BOA | 3,746,977.30 | 112 |
| 0x1c98d8…88001 | creo | 3,122,961.38 | 4,332 |
Symbols in this table are unverified token metadata. The token at 0x8e98…8f9d9 calls itself “USDC”; it is not Arc’s verified USDC interface at 0x3600000000000000000000000000000000000000. The same rule applies to tokens named ARGUS or TOLLY: a name alone does not bind a token to a platform. Addresses determine identity. Saved token metadata.
3. Which launchpads attracted trading?
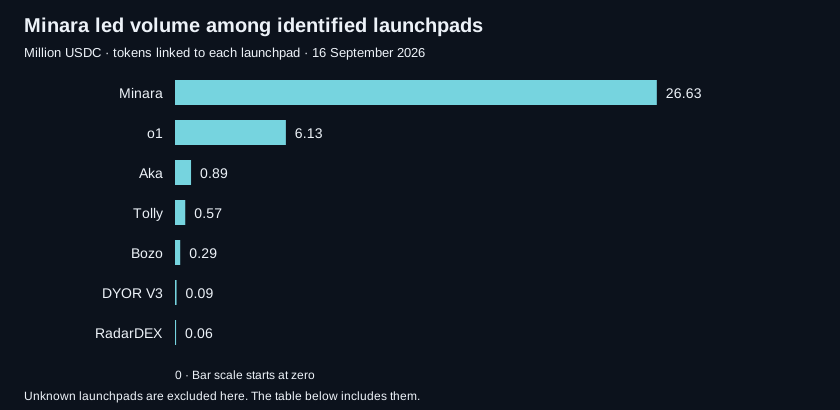
The search screened 55 names, retaining 49 mainnet research candidates. We mapped events for 24 named groups and four unnamed factories. NebulaPad failed a token-binding sample and was held out, leaving 23 named groups and four unnamed groups in the sample-passing registry. “Sample-passing” means the event-to-token field mapping passed first/last-token receipt and code checks for that group; every token was not checked separately.
| Mapped launch source | USDC turnover | Trader addresses | Swaps |
|---|---|---|---|
| Minara | 26,631,540.96 | 14,707 | 235,306 |
| o1 | 6,128,188.36 | 10,058 | 79,650 |
| Aka | 887,599.94 | 2,769 | 11,956 |
| Tolly | 565,940.66 | 2,506 | 12,806 |
| Bozo | 287,571.94 | 751 | 3,034 |
| DYOR V3 | 85,656.73 | 623 | 1,789 |
| RadarDEX | 60,092.64 | 355 | 1,507 |
| Argus | 28,216.32 | 110 | 271 |
| ArcPad | 8,123.44 | 147 | 591 |
| PEGD | 5,418.70 | 53 | 116 |
| Flipt | 4,025.12 | 50 | 87 |
| Archemist (V2 set) | 1,780.81 | 29 | 97 |
| Sharc | 557.01 | 7 | 30 |
Scope of this table: all saved mapped tokens, including launches observed from 04:20:06 UTC before the trading window; turnover is measured only from 06:19:10 UTC. The token registry lacks older history. Newer Archemist V4 events are also outside its mapped V2 set. Low results for Flipt, Sharc, Warp and other curve-based paths cannot establish low total platform use when their curve trades are not verified in this cube.
The unnamed factory 0xb021be536808f551b31789422fd28a6c9c6e97da accounts for 31.58% of wider USDC turnover. Unattributed records account for 46.50%. Known branded sets therefore explain only about 21.64%; the remaining unnamed factories explain the balance. A shared topic with another launchpad is insufficient to assign the large unknown group to that brand. Additive origin totals, coverage register.
Minara’s lead survives removal of its largest token
The example token supplied for this research, 0xa163d7624da3b5d9182c50eab5b8cd247ae861bb, led all base-token groups with 13.54 million USDC, 100,268 pool executions and 8,143 trader addresses. It supplied 50.85% of mapped Minara turnover. Removing every swap touching it leaves 13.09 million USDC and 10,123 addresses in the Minara set, still above the full mapped o1 set at 6.13 million USDC.
Minara also had activity beyond its creation transactions. For its new launches, 99.69% of measured turnover occurred in later blocks. Across its mapped set, 22.21 million USDC was in original launch pools and 4.42 million in other pools. The latter is 16.61%; it shows trading elsewhere, without proving a formal graduation or migration event. Largest-token exclusions, launch phases, pool split.
The rank is sensitive lower down. Aka falls from 887,600 to 100,572 USDC when its largest token is removed. Tolly falls from 565,941 to 453,687 USDC. Tolly then moves ahead of Aka. Removing the ten largest trader addresses leaves 22.66 million USDC for Minara, 5.06 million for o1 and 493,605 for Tolly. Token concentration and address concentration answer different questions. Address exclusions.
4. Many launches did not sustain a busy first hour
There were 32,100 token-address bindings to sample-passing launch groups inside the common window. 28,005 belonged to unnamed factories. This is a count for the mapped event families, not all token creation on Arc. The largest unnamed factory alone emitted bindings for 27,881 tokens. Launches in the common window.
Equal-age comparisons include only launches by 13:00 UTC, so every token has 60 minutes of follow-up. Tokens with no matched cube trades stay in the denominator. The resulting set contains 25,919 tokens.
| Launch source | Eligible tokens | Median first-hour USDC | 5+ non-creator buyers | No trade in minutes 45–60 |
|---|---|---|---|---|
| Minara | 1,321 | 414.72 | 333/1321 | 85.92% |
| o1 | 848 | 673.20 | Unknown creator | 91.39% |
| Aka | 17 | 1,697.94 | 12/17 | 64.71% |
| Tolly | 735 | 20.79 | 191/735 | 94.97% |
| RadarDEX | 175 | 14.06 | 26/175 | 96.57% |
| Bozo | 53 | 0.79 | 3/53 | 90.57% |
| ArcPad | 54 | 16.34 | 18/54 | 90.74% |
| Flipt | 204 | 0.00 | 1/204 | 99.51% |
| Sharc | 24 | 0.00 | 0/24 | 95.83% |
Minara had 1,321 eligible launches. 1,239 had a matched trade in their first hour, but only 333, or 25.21%, reached five observed buyer addresses other than the known creator. 161 reached 20 such addresses. The median token had three buyer addresses in total. Excluding the creator address cannot exclude other addresses the creator may control.
For 1,135 of those 1,321 tokens, or 85.92%, no cube trade appeared in minutes 45–60. Only 68 had an observed non-creator buyer in that final 15-minute interval. Yet that interval produced 3.13 million USDC across the cohort. A few active tokens can sustain a large total while most of the cohort is quiet.
Tolly’s first-hour median was 20.79 USDC, with 191 of 735 tokens reaching five non-creator buyers. RadarDEX had 26 of 175 reaching that stage. Aka’s 1,697.94-USDC median and 12 of 17 five-buyer conversions look stronger, but 17 tokens are a small, different mix of launches. o1’s median was 673.20 USDC across 848 tokens; creator identity was unavailable, so its non-creator conversion is unknown.
These comparisons are descriptive. A busy market at one launch time can favor a cohort. The appendix retains results by shared 30-minute launch buckets, plus complete first-30-minute outcomes. A zero USDC value can also mean trading in another quote asset, as seen in the Long and Ellipse sets. First-hour cohorts, launch-time groups, first-30-minute results.
5. Traders returned quickly, but addresses are not people
The source’s trader address matched the raw chain transaction sender for every saved execution. By contrast, TransactionHeader.Sender in these cube responses matched the chain sender on just 15 rows and appeared to carry a different address role. The report uses Trader.Address throughout; it does not mix those fields. 68 saved RPC receipts also agreed with the raw transaction sender. Identity audit, final checks.
The median trader address made four trading transactions, touched two base tokens and had 233.09 USDC of turnover. 11,923 addresses, or 19.12%, made one transaction in the whole window. Their opportunity to return differs, so fixed-horizon cohorts give a fairer short-term comparison.
| Time after first observed visit | Eligible addresses | Returned | Rate |
|---|---|---|---|
| 15 minutes | 60,453 | 35,951 | 59.47% |
| 30 minutes | 58,527 | 39,289 | 67.13% |
| 60 minutes | 55,002 | 40,475 | 73.59% |
| 120 minutes | 47,475 | 37,953 | 79.94% |
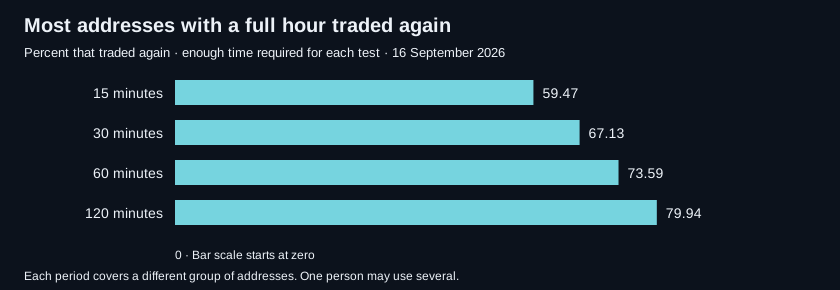
Among the 55,002 addresses with a full hour after first observation, 40,475 returned within that hour, a rate of 73.59%. The median time to the second transaction among those returners was 155 seconds. 20,176 eligible addresses, or 36.68%, traded during minutes 30–60. That later-interval measure is less dominated by immediate repeats.
Of the one-hour returners, 25,531 returned to the same single base token, 12,230 to a different single base token, and 2,714 had a mixed token set in the first or second transaction. These are first-observed cohorts within a rolling data window. They do not establish new-user growth or long-term retention. Return cohorts, next-token results.
Concentration and fast repeats
The top address generated 14.09 million USDC, or 8.79% of turnover; the top ten 14.01%, and the top 100 25.96%. The leading address, 0xf70da97812cb96acdf810712aa562db8dfa3dbef, made 28,562 transactions and touched 926 base tokens. It had no deployed code at the cutoff block. That check does not identify who controls it or prove a trading strategy.
4,865 addresses had at least one successive trading transaction within one second. Those flagged later transactions carried 19.71 million USDC, or 12.29% of turnover. Removing all activity by those addresses leaves 70.82 million USDC. The two figures differ because an address can have both rapid and slower trades.
At five seconds, 11,131 addresses were flagged; excluding their full activity leaves 45.57 million USDC. Thresholds change the result substantially. These patterns may include arbitrage, repeated manual use or automated trading. They do not establish a bot share or wash trading. Concentration, repeat sensitivity.
6. Launchpad audiences overlap; exits were often quick
Of the 2,506 addresses trading mapped Tolly tokens, 1,287, or 51.36%, also traded mapped Minara tokens. Minara and o1 shared 4,776 addresses, equal to 32.47% of Minara’s audience. Platform audience counts must not be added as if each were a separate set of people. Audience overlap.
The path analysis anchors on the first unambiguous visit to each named platform and requires a full hour of follow-up. Of 2,285 eligible Tolly addresses, 542 next reached o1 and 437 next reached Minara within an hour. 1,181 had no observed different named-platform visit. Unknown and unattributed token sets are outside these paths, so this cannot establish that an address stayed exclusively on one platform. A later visit does not prove dissatisfaction or a permanent move. The next-30-minute value appendix counts only executions assigned to each named source, leaving unrelated route turnover out. Its address/source time windows can overlap. Path results, corrected post-move values.
Across 298,925 address/base-token pairs with a full hour after their first observed buy, 209,959, or 70.24%, had a later sell transaction within that hour. Among those with a sale, median time to it was 129 seconds. The 15-minute result was 58.70% of 332,451 eligible pairs. Same-transaction routing does not count as a later sale.
These are observations of selling, not matched holding periods. Opening inventory, incoming transfers and prior costs are not complete. We therefore cannot say that the sold tokens came from the measured purchase, whether the trader closed the position, or whether the trade made money. Observed sell cohorts.
For Minara, first-minute entrants had a later sale within 30 minutes in 8,651 of 9,885 address/token cases, or 87.52%. Entrants first seen after 15 minutes did so in 10,982 of 19,135 cases, or 57.39%. Entry groups contain different token mixes, so this does not prove an advantage from arriving early. Known Minara creator addresses sold 115,326 USDC and bought 88,843 USDC after launch. Their net quoted cash flow was about 26,482 USDC, with token transfers, launch costs and fee income outside that figure. It is not profit. Entry groups, creator trading.
7. The leading Minara token had large price swings
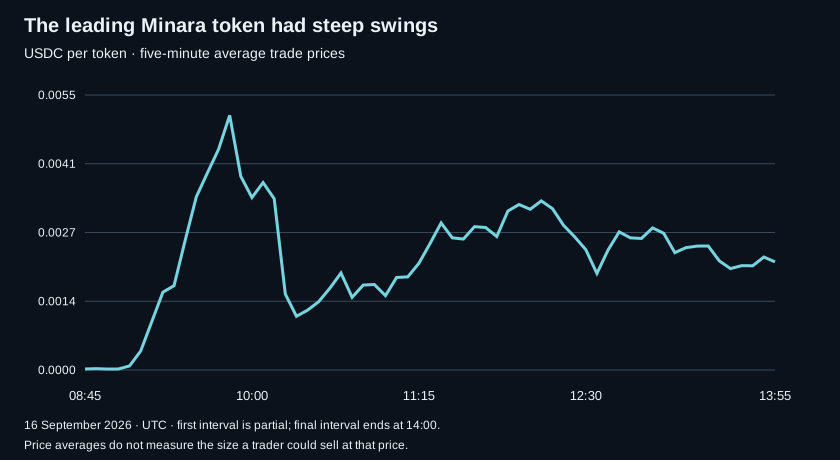
The supplied Minara token’s original pool, 0xd77a1efb…e09bb150, recorded 9.35 million USDC and 7,035 trader addresses. Its five-minute quantity-weighted execution price rose from roughly 0.0000200 to 0.002149 USDC per token between the first and last observed bins, about 107 times. Over the same path, the largest fall from a prior five-minute average peak was 78.90%.
Both statements can be true. The choice of entry and exit time matters greatly. The first bin covers only the observed trades after activity began at 08:46:02 UTC; the last covers 13:55–14:00. These are realized pool execution averages, not an offer available for an arbitrary order size. The other selected pools and their gaps between transactions remain in the appendix. Five-minute paths, price summaries, trade gaps.
No 1,000- or 10,000-USDC exit capacity is inferred from this turnover. Recreating historical price impact would need pool state, dynamic fees and hook behavior at the relevant block. Those checks are incomplete. Likewise, a token’s market value is not money available to sellers.
8. Chain use, costs and money movement
The common window contains 54,509 consecutive saved blocks and 2,908,133 transactions, averaging 105.18 transactions per second. Of those, 2,648,171 succeeded and 259,962 failed, an 8.94% chain-wide failure rate. Failed transaction intent is not classified, so this is not a failed-sell rate.
| Observed transaction category | Transactions | Network fees, USDC |
|---|---|---|
| launch only | 26,464 | 5,470.06 |
| neither identified | 1,565,092 | 31,805.07 |
| trade and launch | 5,636 | 1,424.76 |
| trade only | 1,310,941 | 76,965.09 |
Transactions containing a captured trade account for 45.27% of all chain transactions and 59.72% of gas used. The two trading categories together are counted once per transaction. “Neither identified” can include activities beyond the covered trade and launch families. Chain totals, activity mix.
Network fees across all transactions totaled 115,664.98 USDC. Median fee was 0.009903 USDC. Trading transactions paid 78,389.85 USDC, with a median of 0.016073 USDC. This excludes separate pool and hook fees. Those fees have not been assigned to creators, platforms or liquidity providers. Network fees, trading transaction costs.
The busiest complete hour by chain transaction count was 09:00–10:00 UTC, with 414,410 transactions and a median fee of 0.008025 USDC. The quietest complete hour, 07:00–08:00, had 327,417 transactions and a median fee of 0.005860 USDC. This is an association within the measured window; transaction mix also differs. Busy/quiet comparison.
New contracts: a partial count is the only supported result
There were 154,505 successful internal creation traces in the common window. The wider 04:20:06–14:00 raw-source view has 176,453. These are creation actions, not verified unique contract addresses. The trace fields do not expose the resulting address, and the broad creation flag also includes ordinary top-level calls. Using that flag alone would overstate contract creation.
Consequently, full new-contract counts, full new-token counts and the share of new contracts later used by another sender remain unavailable. The mapped launch-token counts above are a separate partial view. Common-window creations, creation-field checks.
470.90 million USDC moved through the ERC-20 view
The ERC-20 USDC view contains 3,367,102 transfer records, totaling 470,903,959.62 USDC. It has 63,093 sender addresses and 101,380 receiver addresses. Median transfer size was 5.944887 USDC; the largest was 22,808,331.02 USDC.
The native-call view separately totals 552.26 million USDC. Native and ERC-20 records can describe the same funds, and use 18 and six decimals respectively. Adding the views would create an unsupported money-flow total. Repeated transfers within Arc also reuse the same funds. Neither gross total measures new capital, bridge inflow, or funds retained by traders. Transfer values, corrected occurrence-key checks, Arc’s USDC model.
9. What the evidence supports next
Minara leads the mapped named token sets in turnover and reaches a wider measured audience than Tolly or RadarDEX. Its lead persists after its biggest token or ten biggest trader addresses are removed. o1 is the next large named set. Aka has stronger median first-hour results in a much smaller cohort. These are separate findings; there is no combined “best” score.
The largest unanswered question is the identity and full token history of 0xb021…97da. The next is coverage of curve trading and missing contract versions. Either could change a brand ranking. Resolving them has more value for that question than adding decimal places to the current table.
Trader behavior is fast and repeat-heavy. Many observed buyers later sell within minutes, and a small share of addresses accounts for much of the value. That supports further research into trading patterns. It does not establish trader profit, common ownership or wash trading.
Evidence, audit and remaining limits
- Exact saved counts: 235 accepted trade partitions, with no time gaps or overlap. Every saved swap joins a successful transaction with matching time and position. The two repeated selected-field groups were preserved and checked against separate swap events.
- Rolling history: the live source’s earliest row advanced from 06:19:10 to 06:25:23 during capture. The earlier 13,677 rows had already been saved. Counts in the retained overlap agree exactly. The first saved row is not chain birth.
- Block checks: common-window heights and transaction counts reconcile. The wider raw view has 227 missing heights before the common window. Three boundary blocks match public RPC. Receipt samples are checks of those records, not all-chain proof.
- Decoder limits: a 13:00–13:01 sample had 3,395 cube rows versus 3,405 successful raw DEX rows. We did not fill the difference from raw events. That one-minute match rate cannot be applied to the whole chain.
- Value limits: 226 rows lack base quantity but retain quote quantity. Their counts and quote turnover remain; quantity-based claims exclude them. A later reference-USD aggregate differs from saved last-hour values by about 9.18 USD across three protocols. Three strict USDC-quantity comparisons also differ, each by less than 0.002 USDC. Causes are unresolved; all six differences remain in the audit. Reported values use sums of the saved rows. Reference-USD sums are not headline measures.
- Unavailable claims: verified net bridge flows, full-wallet profit, winner share, matched inventory exits, holder growth, classified failed sells and historical executable depth. Missing results remain unknown.
The audit records passed checks and unresolved differences separately. The metric appendix gives a result or a named limit for all 61 planned measures. Audit, methods, metric status, launchpad coverage, file hashes.