Arc Trading on Launch Day: Which Launchpads Led?
Minara led trading volume among the launchpads we identified on Arc's launch day. Its lead held even without its most-traded token. But many new tokens soon fell quiet. How much of the rush lasted?
Arc is Circle's blockchain, with network fees paid in USDC. During the roughly eight hours we studied on launch day, its token markets recorded 160.12 million USDC in trading volume. New tokens drew buyers, and launchpads competed for their trades. Arc's launch post sets out the earlier private phase; Arc's USDC guide explains the fee model.
Trading volume, also called turnover, adds the USDC side of each swap. The same funds can trade many times. A large total does not tell us how much money traders brought to Arc, or how much they made.
Minara led the launchpads we could identify. Even without trades in its most-traded token, it stayed ahead of o1's full total. Yet most new Minara tokens we could follow for a full hour had no trades in our data near its end. That gap between a busy launchpad and a quiet token matters to anyone buying a fresh launch.
The headline counts token trades priced in USDC. It leaves out swaps that show USDC on both sides. The broader totals below include those swaps; their trade and address counts also include trades priced in other assets.
| Measure | Headline token trades | All recorded pool trades |
|---|---|---|
| Trading volume, USDC | 160,122,201.84 | 160,335,817.69 |
| Pool swaps | 1,482,907 | 1,543,945 |
| Trade transactions | 1,314,716 | 1,316,577 |
| Trader addresses | 62,266 | 62,369 |
economic-usdc-overview CSV · trading-overview CSV · same-denomination-swaps CSV
Launchpad results · Trader behavior · Chain use and fees · Full research and data
When we measured trading
We studied trading on Arc's launch date. Our data starts with the first trade we captured, which does not tell us when public trading began.
Bitquery's trading data supplies the swap figures. We used Arc's chain records to check trades and measure network use. The Arc API page explains what the data covers. To query the chain yourself, start with the Arc mainnet docs.
Trading eased while address counts held steady
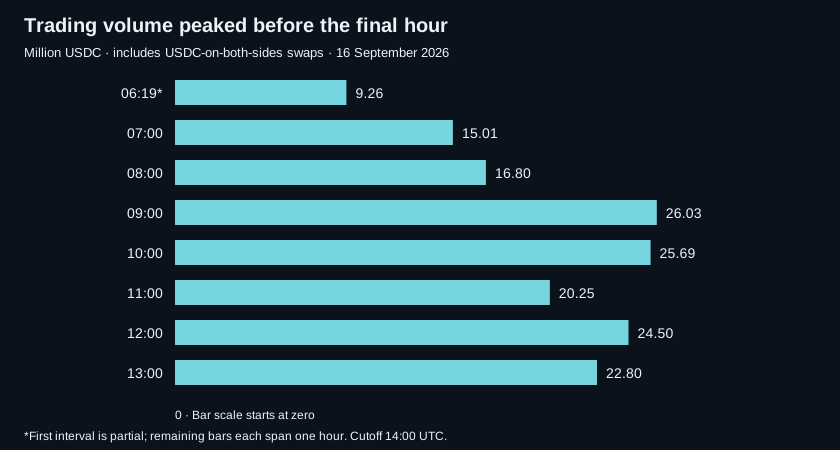
Trading volume peaked before the swap count did. In the next hour, there were more swaps but less USDC traded. The average swap was smaller.
In the final hour, both volume and swap count fell. The number of active addresses barely moved. They made fewer swaps on average, while the average swap grew larger. The slowdown did not come with a broad drop in that active group.
| UTC hour start | Pool swaps | Addresses | Trading volume, USDC |
|---|---|---|---|
| 06:00 * | 99,584 | 11,694 | 9,259,388.47 |
| 07:00 | 160,100 | 16,487 | 15,011,435.86 |
| 08:00 | 166,511 | 17,742 | 16,796,555.37 |
| 09:00 | 242,861 | 20,900 | 26,028,866.25 |
| 10:00 | 249,613 | 22,146 | 25,693,462.02 |
| 11:00 | 187,411 | 20,583 | 20,248,897.90 |
| 12:00 | 238,623 | 24,560 | 24,498,548.66 |
| 13:00 | 199,242 | 24,458 | 22,798,663.16 |
Addresses active in both of the final two hours traded less in the last hour. Those seen only in that last hour added volume. But they did not fully replace the earlier volume from addresses that stopped trading.
| Addresses compared | Change in USDC turnover |
|---|---|
| Present in both hours (12,265) | -1,384,879.05 |
| Later hour only | 5,147,238.57 |
| Earlier hour only (subtract) | -5,462,245.02 |
| Net change | -1,699,885.50 |
An address seen only in the later hour may still have used Arc before. These trades cannot tell us why someone changed pace.
Most swaps were small. The median, the middle value when trades are sorted by size, was well below the average. Tiny swaps made up a large share of the count but little of the volume. Larger trades carried much more of it.
| Measure | Value |
|---|---|
| Median swap, USDC | 36.60 |
| Average swap, USDC | 107.93 |
| 90th / 99th percentile, USDC | 232.87 / 1,026.05 |
| Swaps below 10 USDC: count share | 27.62% |
| Swaps below 10 USDC: value share | 1.16% |
| Swaps from 100 to under 1,000 USDC: value share | 54.70% |
| Trade transactions with several pool swaps | 154,638 (11.75%) |
| Most pool swaps in a trade transaction | 50 |
trade-size CSV · transaction-routing CSV · trading-overview CSV
A single trade can pass through several pools, each holding assets for swaps. We count each pool swap in the volume total. That is why swap count can be much higher than the number of trade transactions. A DEX data feed lets you track both.
Most swaps used Uniswap V4 pools
Most swaps in our data used the Uniswap V4 format. Many apps can use the same pool design. This does not identify the website where someone traded or the launchpad that created a token.
| Pool format | Swaps | Trading volume, USDC | Value share |
|---|---|---|---|
| Uniswap V4 | 1,265,968 | 120,553,057.20 | 75.19% |
| Uniswap V3 | 254,873 | 36,682,099.76 | 22.88% |
| Uniswap V2 | 22,929 | 3,080,892.79 | 1.92% |
| Aerodrome V1 | 175 | 19,767.94 | 0.01% |
protocols CSV · trading-overview CSV
The busiest tokens help explain where the volume went. The table ranks them by trading volume against USDC. Some may have launched before the hours we studied.
| Token address | Reported symbol | Trading volume, USDC | Addresses |
|---|---|---|---|
| 0xa163d7…861bb | Minara | 13,542,321.91 | 8,143 |
| 0xece5ca…2cb3c | ARGUS | 12,734,010.69 | 8,082 |
| 0x8e98a6…8f9d9 | USDC | 6,066,095.83 | 2,841 |
| 0x2ba0f4…b043b | CRCL | 5,517,210.63 | 4,224 |
| 0xbc43ce…90b67 | TOLLY | 4,486,946.34 | 3,863 |
| 0x30ac39…4c84a | PI | 4,144,471.21 | 3,801 |
| 0x8b903a…b9e3c | BOA | 3,746,977.30 | 112 |
| 0x1c98d8…88001 | creo | 3,122,961.38 | 4,332 |
One heavily traded token calls itself "USDC," but its address differs from Arc's verified USDC address, 0x3600000000000000000000000000000000000000. Token names such as ARGUS and TOLLY need the same care. Anyone can copy a name. The address tells you which token you are buying.
The same check matters for launchpad rankings. A familiar token name alone cannot prove where it launched.
Which launchpads drew the most trading?
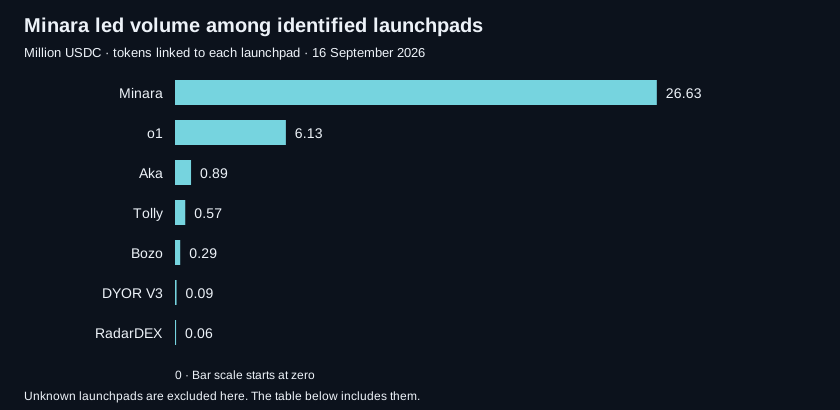
A launchpad helps create tokens and their first markets. We linked tokens to the contracts that created them, then measured trading in those tokens. This includes trades in pools beyond the launchpad itself.
We checked more names than appear in the ranking. Some could not be linked to a contract. We left NebulaPad out because a token check failed. This is a data gap and says nothing about the project's honesty. The methods give the details.
| Launchpad or group | Trading volume, USDC | Addresses | Pool swaps |
|---|---|---|---|
| No launch record matched | 74,551,261.06 | 46,629 | 557,793 |
| Unknown b021 | 50,627,580.15 | 30,053 | 628,957 |
| Minara | 26,631,540.96 | 14,707 | 235,306 |
| o1 | 6,128,188.36 | 10,058 | 79,650 |
| Aka | 887,599.94 | 2,769 | 11,956 |
| Tolly | 565,940.66 | 2,506 | 12,806 |
| Unknown 58e5 | 348,515.87 | 1,268 | 4,608 |
| Bozo | 287,571.94 | 751 | 3,034 |
| Unknown bbf8 | 103,133.42 | 464 | 1,356 |
| DYOR V3 | 85,656.73 | 623 | 1,789 |
| RadarDEX | 60,092.64 | 355 | 1,507 |
| Argus | 28,216.32 | 110 | 271 |
| Unknown fa59 | 8,900.91 | 66 | 187 |
| ArcPad | 8,123.44 | 147 | 591 |
| PEGD | 5,418.70 | 53 | 116 |
| Flipt | 4,025.12 | 50 | 87 |
| Archemist (V2 set) | 1,780.81 | 29 | 97 |
| Cusp | 1,409.30 | 15 | 29 |
| Sharc | 557.01 | 7 | 30 |
| UBI | 185.05 | 7 | 14 |
| Long | 99.14 | 1,086 | 3,715 |
| Dagg | 20.18 | 3 | 4 |
| Ellipse V3 | 0.00 | 17 | 42 |
Minara had the most volume among the launchpads we identified, followed by o1. Much of Arc's trading still could not be tied to a named launchpad.
Tokens from one unknown factory, a contract that creates tokens, had more volume than Minara's. Its address is 0xb021be536808f551b31789422fd28a6c9c6e97da. We could not confirm the platform behind it. Much more trading involved tokens we could not link to a launch record. Together, the named launchpads account for only a minority of total USDC volume.
Our data may also miss trades handled by some launchpads' own contracts, such as Flipt, Sharc and Warp. Archemist's figures cover an older contract version, and some older tokens are missing. A small total here does not prove low use across a whole platform.
Does Minara rely on one hit?
Minara's most-traded token supplied about half its volume. We counted again without swaps in that token. Minara still had more volume than o1's full total.
| Launchpad or group | Total volume, USDC | Excluding the most-traded token | Excluding the top ten addresses |
|---|---|---|---|
| Minara | 26,631,540.96 | 13,089,219.05 | 22,662,194.50 |
| o1 | 6,128,188.36 | 3,005,226.98 | 5,058,789.57 |
| Aka | 887,599.94 | 100,572.26 | 819,134.33 |
| Tolly | 565,940.66 | 453,687.04 | 493,604.79 |
| RadarDEX | 60,092.64 | 37,266.09 | 44,212.14 |
origin-turnover CSV · largest-token-exclusion CSV · origin-wallet-stress CSV
The same test changes the order below them. Aka loses much more volume when its top token is left out, putting Tolly ahead. We also ran a separate test that excludes all trades by each platform's ten top addresses by volume. Minara kept its lead among the named launchpads.
Minara's tokens kept trading after launch. Almost all volume in its new tokens came after the block in which they launched. Some trades also took place in other pools.
| When Minara tokens traded | Swaps | Trading volume, USDC |
|---|---|---|
| later block | 234,493 | 26,547,829.45 |
| launch transaction | 813 | 83,711.51 |
| Minara pool group | Swaps | Trading volume, USDC |
|---|---|---|
| original pool | 164,208 | 22,208,666.67 |
| other pool | 71,098 | 4,422,874.29 |
A trade in another pool alone cannot prove that a token has migrated, the step when a launchpad moves it to a new trading pool. The Pons launchpad study tracks that process on another chain. Its figures cover another market and period.
A busy launchpad can have quiet tokens
One hit can make a launchpad look busy. For a trader choosing a fresh token, the more useful question is how the rest of its launches fared.
Most token addresses we linked to launch records came from unnamed factories. The table counts those recorded launches. We could not confirm the full number of tokens created on Arc.
| Recorded launches | Tokens |
|---|---|
| Token addresses linked to launches during the study | 32,100 |
| Tokens from unnamed factories | 28,005 |
| Largest unnamed factory (b021) | 27,881 |
| Tokens with a full first hour of data | 25,919 |
launches-common CSV · launch-cohort-summary CSV
To compare their first hour, we kept only tokens launched early enough to have a full hour of data. Tokens with no trades in our data still count. This gives each token the same time to find buyers.
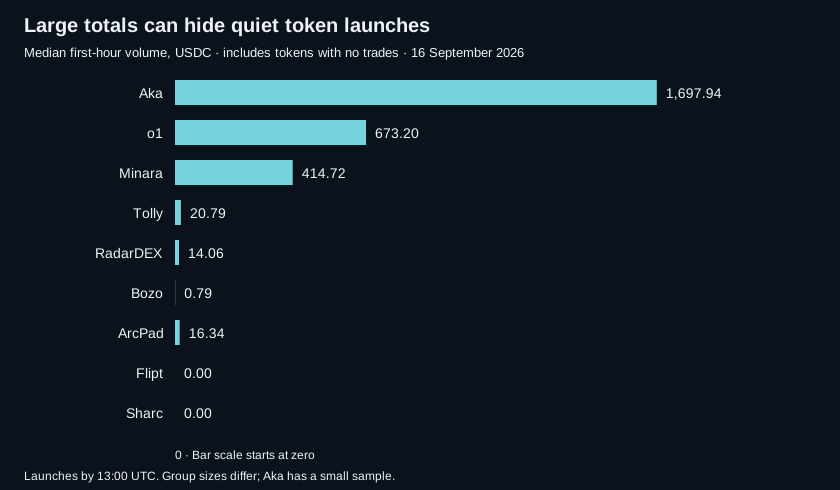
Minara's median first-hour volume was much higher than Tolly's or RadarDEX's. Yet only a minority of its tokens reached five buyer addresses besides the known creator.
| Launchpad | Tokens with a full hour | Median first-hour volume, USDC | Tokens with 5+ buyers besides the creator | No trades in minutes 45–60 |
|---|---|---|---|---|
| Aka | 17 | 1,697.94 | 12/17 | 64.71% |
| o1 | 848 | 673.20 | Creator unknown | 91.39% |
| Minara | 1,321 | 414.72 | 333/1,321 | 85.92% |
| Tolly | 735 | 20.79 | 191/735 | 94.97% |
| RadarDEX | 175 | 14.06 | 26/175 | 96.57% |
| Bozo | 53 | 0.79 | 3/53 | 90.57% |
| ArcPad | 54 | 16.34 | 18/54 | 90.74% |
| Flipt | 204 | 0.00 | 1/204 | 99.51% |
| Sharc | 24 | 0.00 | 0/24 | 95.83% |
In that full-hour group, most Minara tokens had no trades in our data during the final fifteen minutes. A small group still traded heavily. A busy launchpad was no promise of steady trading in each token.
| Minara first-hour measure | Value |
|---|---|
| Tokens with a full hour of data | 1,321 |
| Tokens with a trade | 1,239 |
| Tokens with 20+ buyers besides the creator | 161 |
| Median buyer addresses | 3 |
| Tokens with no trades in the final 15 minutes | 1,135 |
| Tokens with a buyer besides the creator in the final 15 minutes | 68 |
| USDC turnover in final 15 minutes | 3,134,318.67 |
Leaving out the known creator address helps, though the creator may control other wallets. Aka had a higher first-hour median across a much smaller group of tokens. o1 also had a higher median than Minara. Its creator addresses are unknown, so we cannot count its buyers apart from creators.
Launch time matters too. Tokens released into a busy market may draw more trades than later launches. The detailed results compare launch times and shorter periods. Also, zero USDC volume can mean a token traded against another asset. That happened in the Long and Ellipse groups.
Many addresses came back quickly
The token figures raise another question: did buyers stick around? We followed the addresses that sent trade transactions. One person can use several wallets, so these counts cannot tell us how many people traded.
| Address measure | Value |
|---|---|
| Median trade transactions | 4 |
| Median tokens traded | 2 |
| Median USDC turnover | 233.09 |
| One-transaction addresses | 11,923 |
| Top address USDC | 14,093,379.87 |
| Top address share | 8.79% |
| Top ten share | 14.01% |
| Top hundred share | 25.96% |
trader-summary CSV · trading-overview CSV
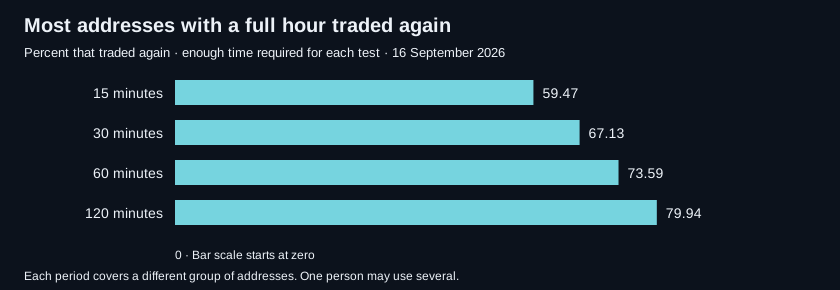
The median address made a handful of trade transactions and traded few tokens. Some made only one trade transaction. To check who returned within an hour, we included only addresses whose first recorded trade left a full hour before the data ended.
| Time after first trade | Addresses with enough data | Traded again | Return rate |
|---|---|---|---|
| 15 minutes | 60,453 | 35,951 | 59.47% |
| 30 minutes | 58,527 | 39,289 | 67.13% |
| 60 minutes | 55,002 | 40,475 | 73.59% |
| 120 minutes | 47,475 | 37,953 | 79.94% |
Most of those addresses traded again within an hour, often quite soon. We also counted who traded during minutes thirty to sixty after their first recorded trade. That rate was lower. It leaves out addresses whose repeat trades all happened in the first half-hour.
| One-hour return measure | Value |
|---|---|
| Traded during minutes 30–60 | 20,176 / 55,002 (36.68%) |
| Median seconds to second transaction, among one-hour returners | 155 |
Many came back to trade the same token. Others tried another one or traded several in a single transaction. These returns show activity within the hours we studied. They cannot tell us how many new users Arc gained or whether those users stayed for days.
Fast repeats carry much of the value
One address, 0xf70da97812cb96acdf810712aa562db8dfa3dbef, led by volume and traded hundreds of tokens. We could not identify its owner or strategy.
Many addresses sent a trade transaction within a second of their last one. One total below counts only those quick follow-up trades. A separate test excludes every trade by the same group, even their slower trades. That removes much more volume.
| Time gap | Addresses with quick repeat trades | USDC in rapid follow-up transactions | USDC left after removing all their activity |
|---|---|---|---|
| same block | 1,868 | 5,914,450.94 | 110,681,004.58 |
| 1 second | 4,865 | 19,713,782.97 | 70,820,362.68 |
| 5 seconds | 11,131 | 37,379,214.56 | 45,566,134.11 |
| 30 seconds | 26,061 | 71,992,459.63 | 17,956,225.90 |
We repeated the test with gaps of five and thirty seconds, and with trades in the same block. Fast repeats can fit bots or arbitrage. Speed alone cannot identify a bot's owner or prove wash trading, where trades give a false sense of demand. A live trading feed can track the pace; intent needs more evidence.
Launchpad audiences shared wallets
Traders did not keep to one launchpad. A large share of addresses trading Tolly tokens also traded Minara tokens. Minara and o1 shared many addresses too. Adding each launchpad's count would count some addresses twice.
| Launchpad | Also traded tokens from | Shared addresses | Share of its addresses |
|---|---|---|---|
| Minara | o1 | 4,776 | 32.47% |
| Tolly | Minara | 1,287 | 51.36% |
launchpad-audience-overlap CSV
After an address first traded tokens linked to Tolly, we checked which other identified launchpad's tokens it traded next. We allowed a full hour to make the move. o1 and Minara were common next stops.
| Next launchpad traded | Addresses | Tolly addresses with a full hour |
|---|---|---|
| DYOR V3 | 19 | 2,285 |
| No trade in another identified launchpad | 1,181 | 2,285 |
| o1 | 542 | 2,285 |
| Minara | 437 | 2,285 |
| ArcPad | 5 | 2,285 |
| PEGD | 8 | 2,285 |
| Long | 20 | 2,285 |
| Aka | 31 | 2,285 |
| Argus | 5 | 2,285 |
| RadarDEX | 15 | 2,285 |
| Bozo | 14 | 2,285 |
| Dagg | 1 | 2,285 |
| Several launchpads in one transaction; next platform unclear | 6 | 2,285 |
| UBI | 1 | 2,285 |
Many made no such move within the hour. They could still have traded tokens from launchpads we could not identify. Trading on another launchpad also does not tell us why someone moved.
The detailed results also track trading volume after these moves. Some periods overlap, so those amounts should not be added into a chain total.
Later selling was common
Did buyers hold, or sell soon after buying? We checked each address separately for each token it bought. One address buying two tokens counts twice. Among cases with a full hour of data after the first recorded buy, most showed a later sale of that token. For those that sold, the wait was often short.
| Time after first buy | Address-token cases with enough data | Cases with a later sale | Rate | Median seconds to sale |
|---|---|---|---|---|
| 15 minutes | 332,451 | 195,154 | 58.70% | 79 |
| 60 minutes | 298,925 | 209,959 | 70.24% | 129 |
For Minara, buyers first seen near launch were more likely to sell within the next half-hour than buyers first seen much later. Each group held its own mix of tokens. This does not prove that buying earlier paid off.
| First buy after Minara launch | Address-token cases with enough data | Later sell within 30 minutes |
|---|---|---|
| 0–1m | 9,885 | 8,651 |
| 1–5m | 5,963 | 5,001 |
| 5–15m | 5,241 | 4,221 |
| 15m+ | 19,135 | 10,982 |
An address may already have held tokens or received them from another wallet. A later sale cannot tell us whether the buyer sold the tokens from that purchase, closed the full position or made a profit.
The Minara creator addresses we identified received more USDC from token sales than they spent on token buys after launch.
| Known Minara creator activity | USDC |
|---|---|
| USDC spent on token buys | 88,843.26 |
| USDC received from token sales | 115,325.58 |
| Sales minus buys | 26,482.32 |
That cash-flow gap leaves out token transfers, launch costs and fee income. It cannot show profit. The same need for a full wallet history applies to crypto tax work.
Prices add another reason for care. Even the busiest token could leave a late buyer facing a sharp fall.
The leading Minara token rose sharply and fell hard
Minara's most-traded token, 0xa163d7624da3b5d9182c50eab5b8cd247ae861bb, drove much of its volume. In its original pool, the price rose sharply and then fell from its peak.
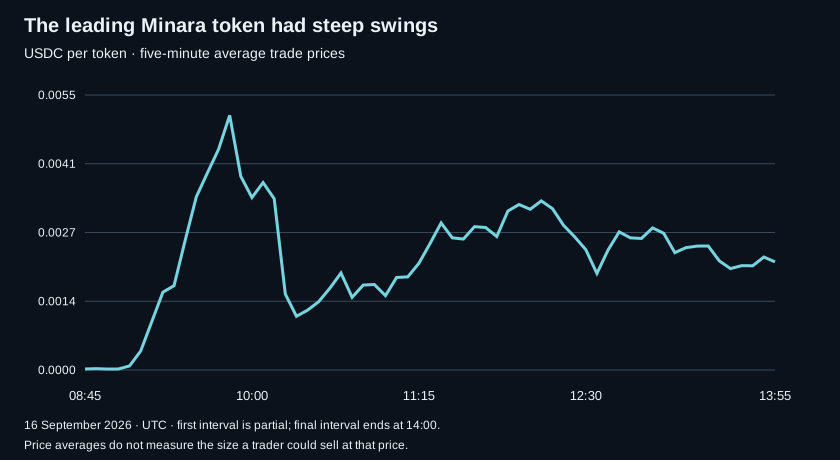
The final five-minute average price was far above the first. But a buyer who entered at a peak could have faced a steep fall before that final point.
| Original-pool price measure | Value |
|---|---|
| First five-minute average, USDC/token | 0.0000200122 |
| Last five-minute average, USDC/token | 0.0021490414 |
| Last / first average | 107.39× |
| Largest fall from prior five-minute average peak | 78.90% |
selected-pool-price-summary CSV · selected-pool-price-paths CSV · selected-pool-trade-gaps CSV
Each point shows the average trade price during five minutes. Trades of more tokens carry more weight. The first point covers less than five minutes because the pool had only just started trading.
These are prices at which trades took place. A large sell could have received a much worse price. The price API and pool-price guide explain why the chosen market matters.
High volume does not ensure deep liquidity: enough funds in the pool to handle a large sell without a steep price drop. We have not measured how much a holder could sell at a given price.
How much did users pay in network fees?
All those swaps also put load on Arc. Trading made up a large share of chain transactions and an even larger share of gas use, the work needed to process them.
| Chain measure | Value |
|---|---|
| Transactions | 2,908,133 |
| Successful | 2,648,171 |
| Failed | 259,962 |
| Failure rate | 8.94% |
| Mean transactions per second | 105.18 |
| Observed category | Transactions | Network fees, USDC |
|---|---|---|
| launch only | 26,464 | 5,470.06 |
| neither identified | 1,565,092 | 31,805.07 |
| trade and launch | 5,636 | 1,424.76 |
| trade only | 1,310,941 | 76,965.09 |
Some transactions failed. We do not know what all of them tried to do, so this failure rate cannot tell us how often traders were unable to sell.
Users pay network fees each time they send a transaction. The median fee was small, but fees added up across millions of them. The median fee for a trade was higher than the median across all chain use.
| Fee measure | USDC |
|---|---|
| Chain-wide total | 115,664.98 |
| Chain-wide median | 0.009903 |
| Trade transaction total | 78,389.85 |
| Trade transaction median | 0.016073 |
chain-common CSV · network-fee-distribution CSV · network-trade-cost-summary CSV
Pool trading fees are separate and are not included here. We also compared network fees in a busy hour with a quieter hour. The busy hour had a higher median fee, but the mix of uses had changed too. We cannot claim that more activity alone caused the higher fee. The exact hours and results are in the methods below.
How many new contracts were created?
We counted records of contract creation, but some lack the new contract's address. That prevents a checked count of unique new contracts.
The token launch counts above cover the launchpads and factories we could track. They cannot fill this chain-wide gap. Contract creation records and their limits remain in the full research results.
Transfers reuse the same funds
USDC moved around Arc far more than the trading total alone suggests. But the same funds can move many times, and some transfers appear in more than one type of record.
| USDC record type | Records | Total transferred, USDC |
|---|---|---|
| ERC-20 token transfers | 3,367,102 | 470,903,959.62 |
| Native USDC transfers | 3,313,111 | 552,260,040.44 |
transfer-common CSV · transfer-key-check CSV
Arc records USDC movements both as native transfers and through its ERC-20 token interface. Some records can describe the same transfer. Adding these totals would risk counting the same money twice.
Neither total tells us how much new money entered Arc or how much stayed there. That needs a separate check of funds moving into and out of the chain. The cross-chain API can help trace those flows.
Minara led volume. Did the rush last?
Minara led volume among the launchpads we identified, even after the separate tests excluding its top token or top traders. Aka had a higher median first-hour volume across a much smaller group of tokens. Tolly relied less on one hit than Aka did. The answer changes with what a trader wants to measure.
The unknown factory had more volume than Minara, and some launchpad trades are missing. Naming the platform behind that factory and filling those gaps could change the ranking.
The rush lasted longer for some tokens than others. Many addresses traded again within an hour. Yet most new Minara tokens with a full hour of data had no trades near its end. For anyone holding one of those tokens, fresh buyers and enough liquidity to sell matter more than the launchpad's total volume. Whether buyers would stay beyond these first measured hours remains open.
Full research, methods and data
Download the result tables and methods to check the figures. The files keep values before rounding. Larger tables are compressed, and the field guide explains how to read them.
- Read the full research appendix: every finding from the corrected report, with the original detail tables.
- Methods and definitions, audit and open differences, and CSV field guide.
- File hashes and export manifest, question-to-result map, and full coverage map.
Six small value checks remain unresolved in the source research; the trade counts agree. The amounts and all other data limits are listed below and in the linked audit. Profit, win rate and net inflows remain unknown. We also have not measured how much a trader could sell at a stated price.
Methods, checks and known data gaps
Time and trading totals
The trading period is 11:49:10–19:30 IST. The wider raw-chain data starts at 04:20:06 UTC. The official launch event listed a 15:30 UTC pre-show and 18:00 UTC main stage, both after the cutoff. Neither is treated as the chain's activation time.
Trade figures use Bitquery's Trading.Trades cube. The headline excludes swaps between native USDC and its ERC-20 view. Both refer to the same unit. Broader USDC totals retain those rows; broader trade and address counts also include trades priced in other assets. Price-based USD estimates stay separate from USDC amounts.
The base token is the asset being priced; the quote asset is the unit used to price it. Token counts refer to base tokens. Assets seen only on the quote side fall outside that count. The price chart weights trades by base-token quantity and leaves out records missing that quantity.
Launchpad and trader checks
The launchpad links passed receipt and code checks on the first and last token sampled for each group. Those samples do not prove complete token history or contract safety. NebulaPad was excluded because a sample failed to confirm which token a launch record referred to. Similar code and event signatures do not establish who owns an unknown factory.
We counted Trader.Address, which matched the raw chain sender across the saved trades. A different sender field often held another address role. The highest-volume address had no deployed code at cutoff; its owner remains unknown.
After a trader moved between launchpads, the volume comparison counts only pool trades in tokens linked to each launchpad. Other trades in the same route stay out. Some time ranges overlap. The correction history below records changes to those values.
Fees, contracts and liquidity
The fee comparison uses 09:00–10:00 and 07:00–08:00 UTC. The results are in busy-quiet-fees CSV. Pool and hook fees have not been traced to each recipient. Testing the size of a possible sell would need the pool's state, fees and hook rules at the relevant block.
Internal creation traces count records, not unique new contracts. Some lack the created address. A broader creation flag also catches ordinary calls. The full appendix retains the counts for both the trading period and the wider chain-data period. The transfer files preserve each record type's decimal rules and duplicate checks.
Source audit
| Check | Result and limit |
|---|---|
| Original final audit | 103 of 109 checks passed. Six value comparisons remain open; counts agree. |
| Value differences | Three last-hour reference-USD comparisons differ by about 9.18 USD in total. Three USDC checks each differ by less than 0.002 USDC. Saved-row sums supply this article. |
| Corrected post-move values | 1,035 of 9,057 comparisons changed, including 87 sign changes. All 19 targeted correction checks passed; path counts and cohorts stayed the same. |
| Buyer breadth | 342,483 buyer address/base-token pairs span all quotes; 329,608 are USDC-only. Value fields use USDC quotes. These denominators must stay separate. |
| Rolling source | 235 accepted trade slices. The live floor moved from 06:19:10 to 06:25:23 UTC after 13,677 earlier rows had been saved. Retained-overlap counts match. |
| Missing base quantity | 226 rows keep valid quote quantities and counts. Quantity-based price claims leave them out. Missing values remain unknown. |
| Raw/cube sample | 13:00–13:01 UTC: 3,405 successful raw DEX rows versus 3,395 cube rows. No raw rows were added to the trade measures. |
| Sender checks | Trader.Address agrees with the raw sender across the saved trades; 68 saved RPC receipt senders also agree. TransactionHeader.Sender matches on only 15 rows. |
| Block record | 54,509 consecutive common-window blocks. The wider raw view has 227 missing heights before this window. Three boundary blocks were checked through public RPC. |
| Source independence | Raw tables and API records may share upstream data. RPC receipt samples check only those records. |
The study cannot establish holder growth or identify bots from timing alone. The raw capture and private database are not part of the website download.
All 61 questions: 18 measured, 25 partial, 18 unavailable
All 55 launchpad names and their coverage
Every result table, with downloads
Run the next investigation in minutes
Ask any question of the blockchain. Bitquery's AI Investigations agent traces funds, attributes wallets, and writes auditable reports across every major chain.
This article is provided for informational and educational purposes only and reflects analysis of publicly available on-chain data as of the dates indicated. It does not constitute legal, financial, compliance, or investment advice, and nothing in it is a recommendation to buy, sell, or hold any token or asset.
The findings use the fixed Arc snapshot and mapped launch-token sets described above. Token history and curve coverage are partial; sampled event mappings do not prove all token births, contract safety or full-platform market share. Addresses do not identify people. Turnover, later sales and cash flow do not establish profit, wash trading, fresh capital or an available exit price. The six unresolved value comparisons remain disclosed. Newly launched tokens carry a high risk of loss. References to Circle, Arc, launchpads and named tokens describe observed records and bounded inferences; they do not assert unlawful conduct or imply endorsement.
Nothing herein should be relied upon as a definitive determination of fact. Readers should conduct their own independent verification before taking any action. The authors and publisher accept no liability for any loss or damage arising from reliance on this material. All trademarks and company names are the property of their respective owners.