Understanding Blockchain Demand: Analyzing TPS and Throughput Needs
Transactions Per Second (TPS) is the number of transactions a blockchain network can process every second. This number varies for each network. For example, the average TPS of the Bitcoin network is around 7, although this can fluctuate.
Ethereum has consistently maintained its TPS at its maximum capacity, averaging around 12 TPS. However, the launch of CryptoKitties in 2017 triggered a sudden surge in Ethereum's transaction fees due to increased transaction demand driven by CryptoKitties' trading activities.
By this time, there had been a significant surge in people's interest, leading them to explore a decentralized world. Developers recognized this trend and embarked on creating new blockchains.
Ethereum's layer 2 solutions like Polygon and Arbitrum, along with its competitors referred to as Ethereum killers such as BSC, Tron, and Avalanche, entered the market with the advantage of significantly lower transaction fees. These platforms boasted transaction per second (TPS) capacities several times higher than Ethereum's.
A serious question arises regarding the TPS of new blockchains, which can process significantly more TPS than Ethereum. Is there a need to increase this TPS throughput capacity? Hence, it is necessary to scrutinize the TPS of these new blockchains closely.
In this article, we analyze the actual demand for transactions and its growth to observe whether there is a demand for TPS in new blockchains akin to original ones.
TPS of different networks: Avalanche, Tron, Polygon, Arbitrum, BSC, Base, opBNB, Solana
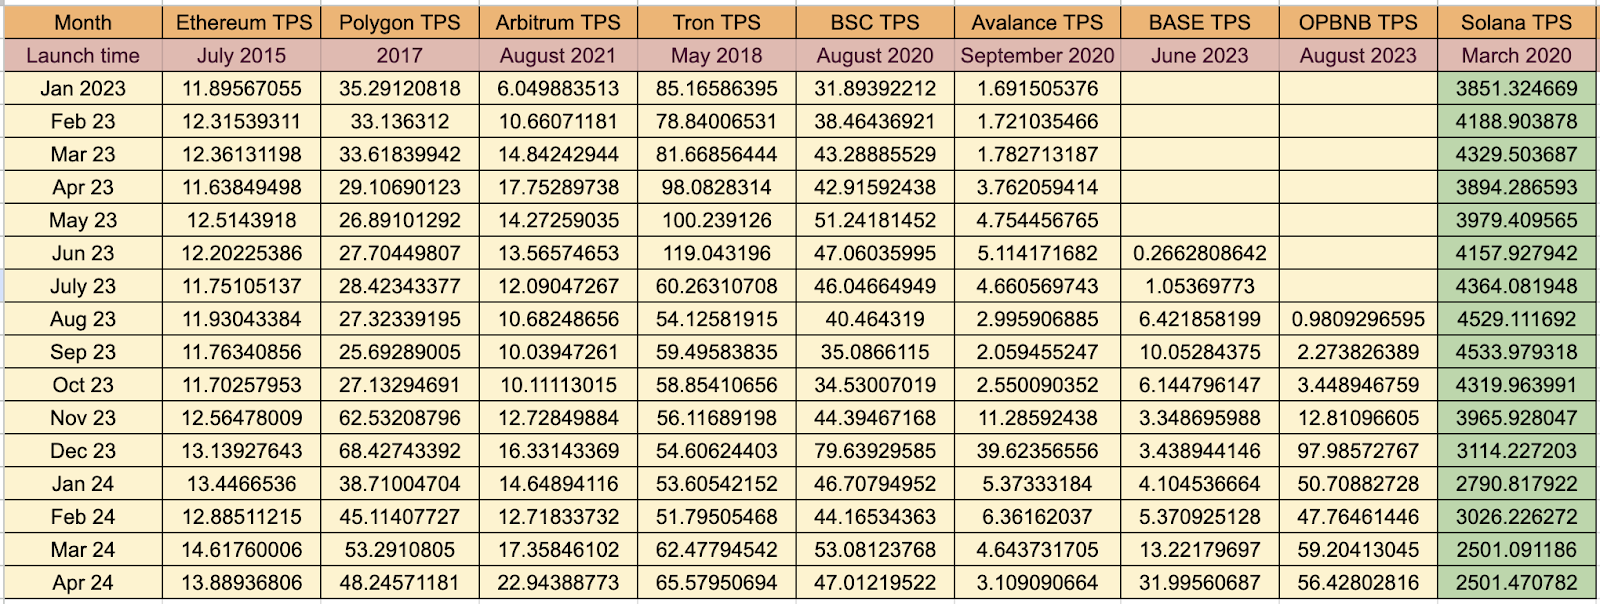
The following table (excel: link 1 & link 2 ) contains the TPS of blockchains.
-
Solana, layer 1 blockchain, went live on the mainnet in March 2020, has a relatively high TPS demand of 2501.4 compared to the other blockchains.
-
Ethereum, the pioneering blockchain for decentralized applications (DApps), has led the industry since its launch in July 2015. Despite facing scalability challenges, it continues to process transactions at its maximum throughput capacity, with a current TPS of 13.8.
-
Base is the latest popular layer 2 solution of Ethereum, launched in June 2023. Its current TPS demand is 31.9.
-
The Avalanche Layer 1 blockchain, launched in September 2020, despite having transaction fees several times lower than Ethereum. It is struggling with transaction demand. Its current TPS is just 3.1.
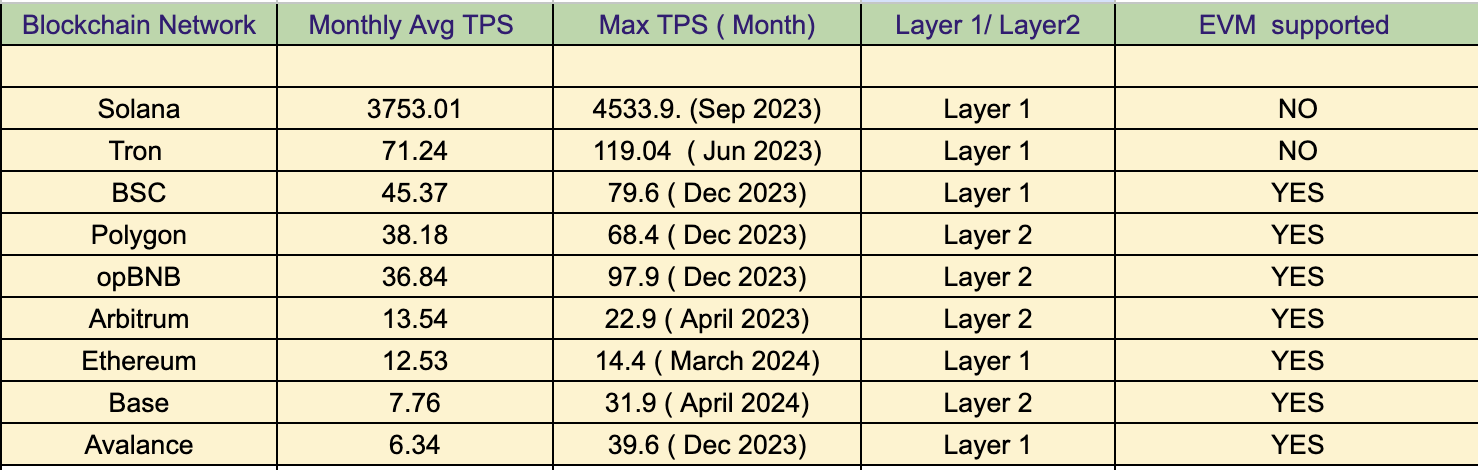
Ranking of Blockchains by Monthly Average TPS Demand (January 2023 - April 2024).
-
Solana leads with a 3753 average TPS, showing the highest demand.
-
Tron follows with 71.24 TPS.
-
opBNB has grown significantly, reaching 62.4 TPS. Polygon, as the top Ethereum scaling solution, handles 38.16 TPS.
-
Ethereum is already processing at its maximum capacity with averages of 12.8 TPS.
-
BSC records 45.3 TPS, while Base surged to 31 TPS in April 2024.
-
Avalanche has the lowest demand, at 6.3 TPS on average.
This analysis shows that newer blockchains like Solana and opBNB effectively meet the high transaction demand. Let’s break down each network in detail in the below sections.
Solana : TPS vs Demand
Solana launched in 2020. Transaction demand in Solana is significantly higher than compared to the other blockchains. Solana registered 3753 TPS on average per month and experienced its high in August 2023 with 4529 TPS.
Solana recorded 300 times more transactions than Ethereum (12.5 TPS on average) and processed 98 times more TPS than Polygon (38.1 TPS on average), which is the highest TPS among Ethereum scaling solutions. To delve deeper into Solana's transactions, check out this article link.
TPS demand in Solana is 480 times higher than the Layer 2 chain Base, and 100 times higher than the Layer 2 chain Optimistic BNB.
Tron : TPS vs Demand
Tron is a non-EVM-supported layer 2 blockchain with a capacity of 2000 TPS. However, on average, Tron saw only 71.24 TPS, just 3.5% of its maximum capacity.
Moreover, Tron is nowhere near Solana in terms of transaction demand. Tron recorded nearly 50 times less TPS on average than the non-EVM chain Solana ( 3753 TPS).
However, Tron has the highest average TPS of all blockchains, followed by Solana. Transactions in Tron peaked in June 2023 with 119 TPS.
The number of transactions per second in Tron has increased by 5.5 times more than in Ethereum, indicating a much higher demand for transactions in Tron than in Ethereum.
opBnB : TPS vs Demand
OP BNB saw TPS with an average of around 4.8, this indicates that TPS demand in OP BNB was low in its initial four months since it launched in August 2023.
However, the TPS demand in opBNB increased 15 times from December 2023 to April 2024, reaching an average TPS of 62.4 (equivalent to 1.3% of its 4600 TPS capacity), surpassing all other blockchains except Solana, which averaged 2786 TPS.
Meanwhile, demand in Tron was around an average of 57 TPS. This indicates opBNB's growing transaction demand.
Ethereum's Scaling Solutions and Other Layer 2 Blockchains
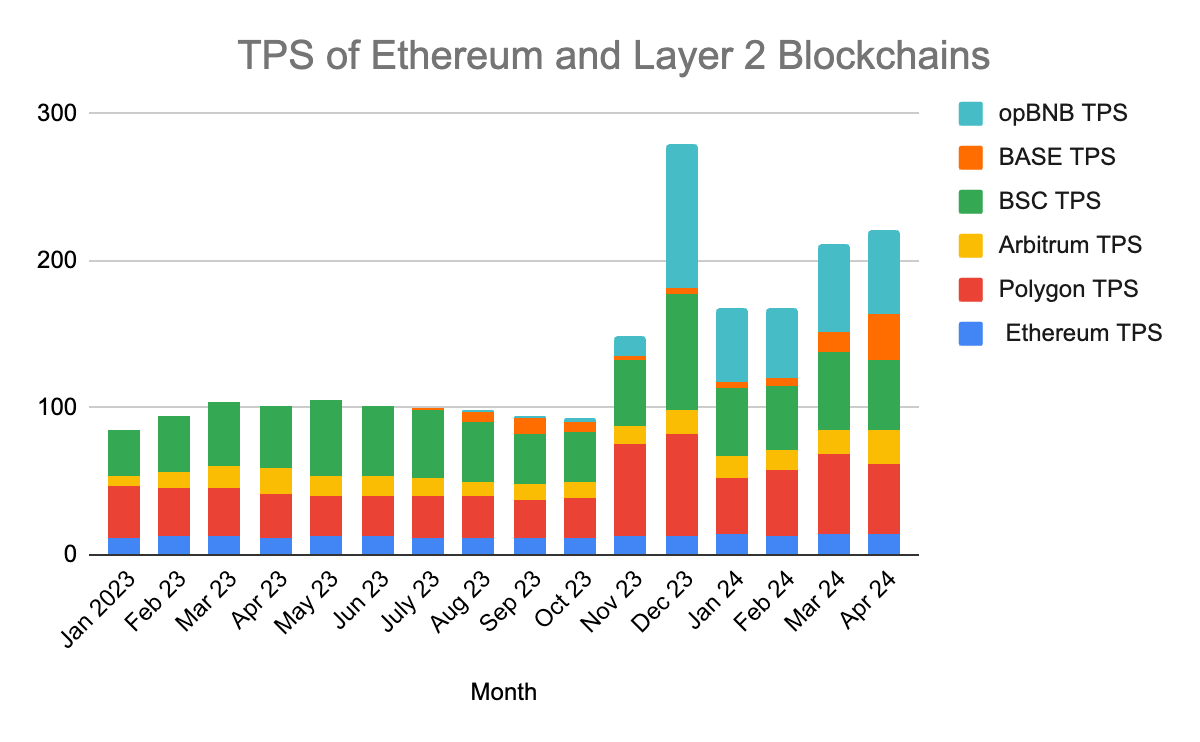
Bitquery data reveals that Polygon recorded only 38.16 TPS on average, which is just 0.5% of its potential (7000 TPS).
However, Polygon is ahead of other Ethereum’s scaling solutions. Polygon recorded 2.6 times more TPS than Arbitrum and 3.08 times more TPS than Ethereum itself, indicating that Polygon has more demand than Arbitrum.
However, despite its lead, Polygon (38.16 TPS) still lags behind BSC in TPS demand, Layer 1 blockchain (45.3 TPS on average), and opBNB (62.4 TPS) in average TPS.
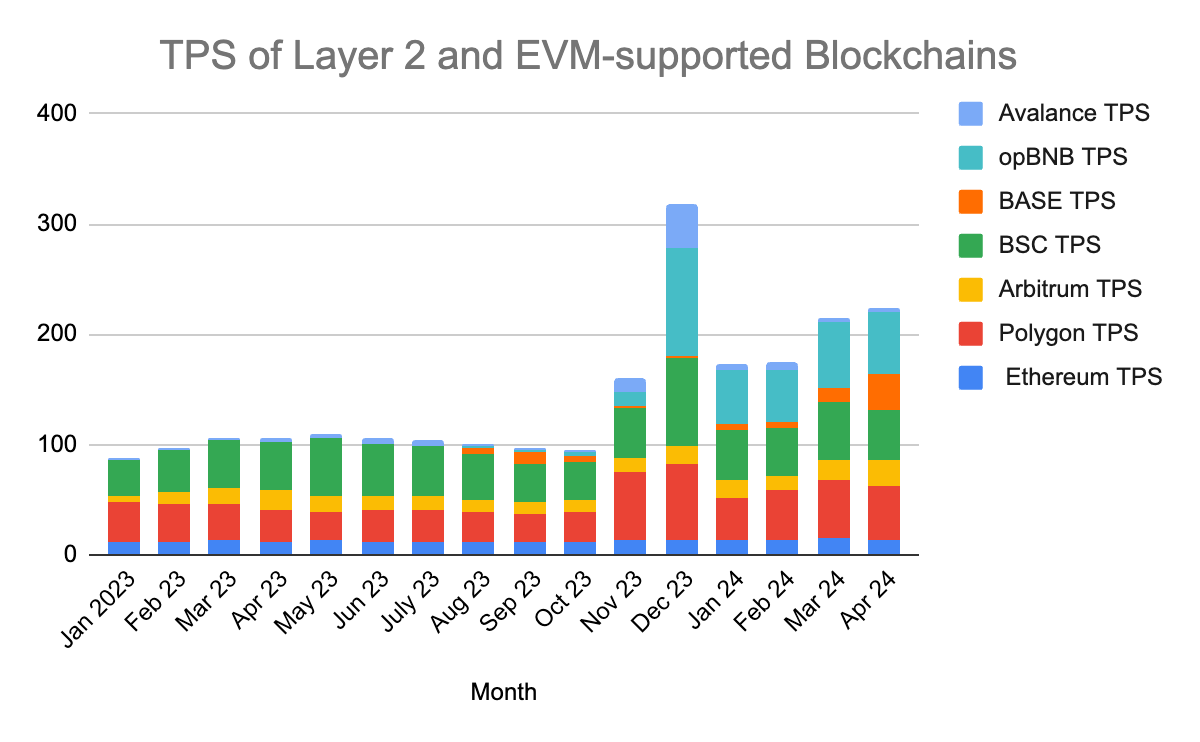
Ethereum’s scaling solutions and other Layer 2 blockchains are supposed to see high demand in TPS, but it is not rising according to market expectations.
TPS Analysis: Ethereum vs Layer 1 and Layer 2 Blockchains
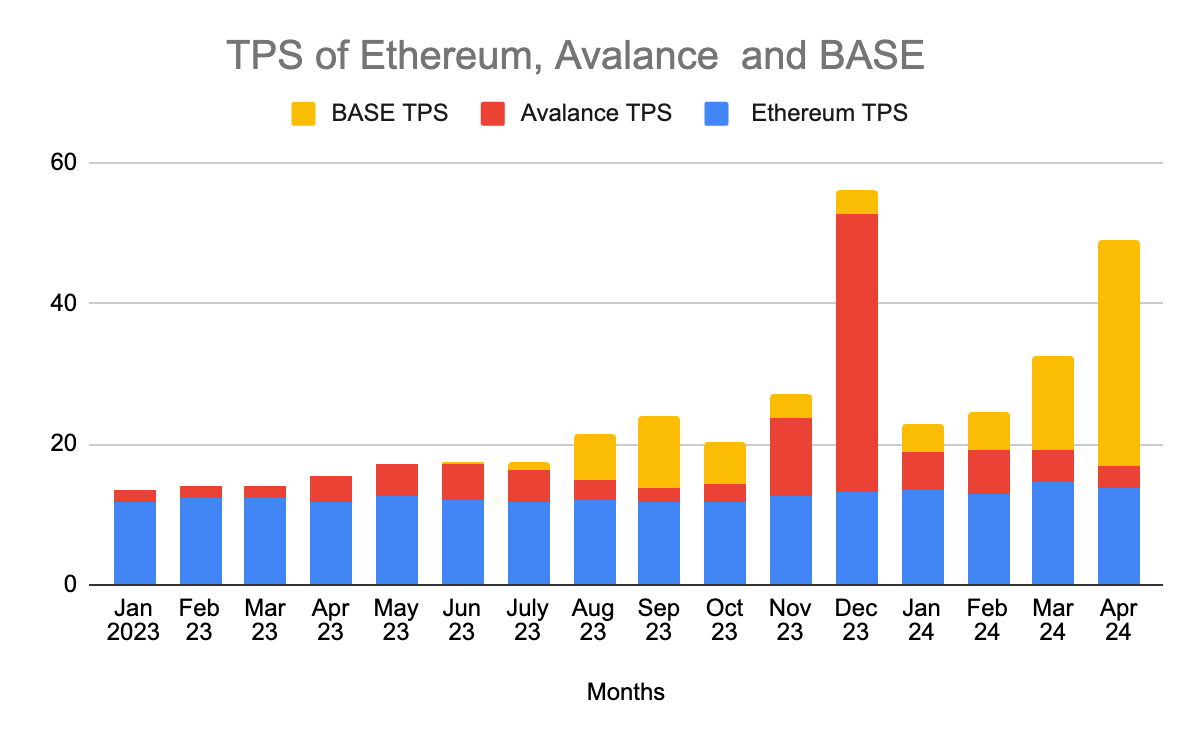
Ethereum overtakes some Layer 1 and Layer 2 blockchains in TPS
From January 2023 to March 2024, Ethereum registered 12.8 TPS on average, indicating that it is relatively 2 times more active than its Layer 1 competitor, Avalanche (5.4 TPS on average), and Coinbase’s Layer 2 Base chain (7.5 TPS on average).
TPS demand in Layer 1 blockchain Avalanche is the lowest among all the blockchains. Only 6.3 average TPS was recorded by Avalanche, which is almost 600 times less than the average TPS recorded by Solana.
The demand for TPS in the Layer 2 Base chain was nearly the same as Avalanche until March 2024 (6.6 TPS). However, in April 2024, the Base chain experienced an unexpected surge in transaction demand, reaching 31 TPS.
Conclusion
Bitquery data reveals that the demand for TPS in Solana is continuously hitting new records, leaving other blockchains behind in TPS demand. Besides the Solana, the demand for TPS does not reach 1% of its maximum throughput capacity. After Solana, TRON has seen the highest demand for TPS. Despite being a Layer 1 chain, BSC experienced a high demand for TPS, surpassing that of Layer 2 blockchains like Polygon, opBNB, and Base. Among all the Ethereum Layer 2 solutions, the demand for TPS is highest on the Polygon chain. Layer 1 blockchain Avalanche saw the lowest demand in TPS among all the blockchains.
-- Article written by Vishal
Subscribe to our newsletter
Subscribe and never miss any updates related to our APIs, new developments & latest news etc. Our newsletter is sent once a week on Monday.


