Analysis of Blockchain Availability Based on Block Lag
By Aleksey Studnev, Bitquery.io, 16 May, 2023
This analysis focuses on examining the on-chain block lag of four blockchain networks: Bitcoin, Ethereum, Solana, and Binance Smart Chain. The aim is to calculate various statistics related to the block time.
To conduct this analysis, data sets were obtained and processed using Pandas tools within a Jupyter Notebook environment. The resulting findings and insights are documented in a GitHub project. By exploring the block lag statistics, we can gain a better understanding of the performance and efficiency of these blockchain networks.
Why Block Lags Matter?
The goal for this analysis is to measure how well blockhain networks of different kind meet client expectations on availability and speed. This is not just defined by the mean statistics, as average block time and transactions per second. The distribution of these parameters is also important, and especially the corner cases of unexpectedly long lags in block times.
When the blockchain network does not add the new block for a long time, all applications that are elying on that network, efffectively stalled. It is equivallent to the program hangs on your computer. Blockchain clients, as wallets or DApps, can not execute transactions, make transfers or smart contract calls.
Too long time lag between the blocks is equivalent to the service outage of the blockchain network. Here we tried to measure how often this happens and how severe it is in different blockchains.
Here we consider outage when the next block does not appear in 10x time interval from the average block period. For example, if average period in Ethereum is 14 seconds, we consider 140 seconds as outage. This is calculated relative to the average values, because the expectations of the clients ( both humans and applications ) are adapted to the average block times, which are very different across blockchain networks
Aggregated Statistics on Block Times
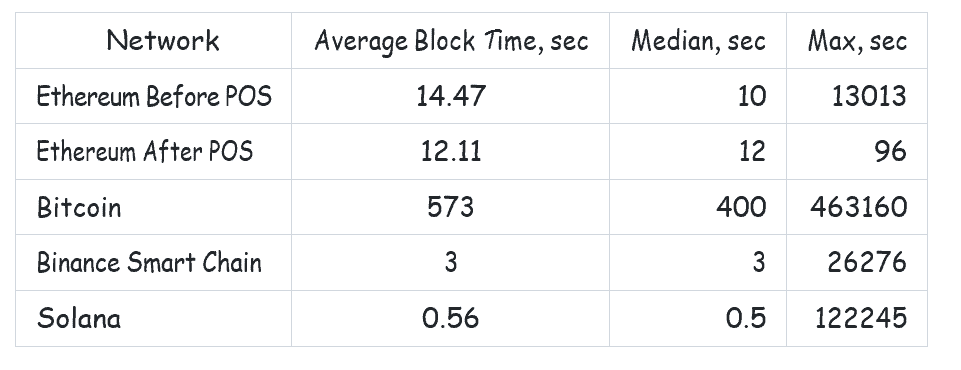
Here is the agregated statistics of the 4 blockchain networks under consideration:

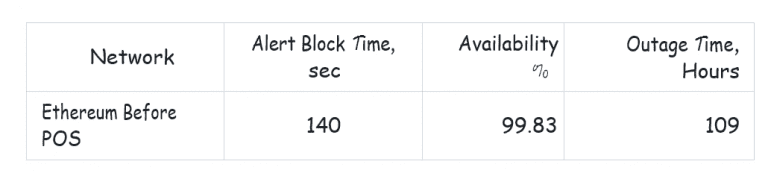
Ethereum can be divided into two periods: before the Proof of Stake (POS) fork and after it, as statistics show notable differences.The table clearly indicates that the maximum time can greatly surpass the average figures, sometimes even extending to hours or even days. We will now examine each chain individually and then return to analyze the SLA figures as a whole.
Ethereum Before POS
The distribution of the block time in Ethereum Before POS ( logarithmic frequency scale ):
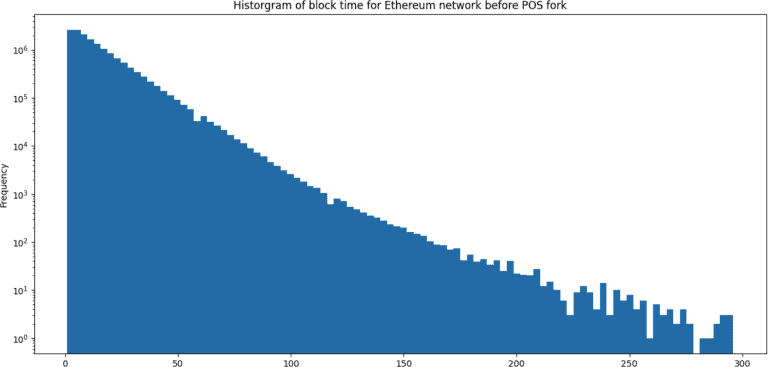
The hystogram in logarithmic scale looks very smooth and has almost linear slope for a range of 10..120 seconds per block. It can be approximately modeled as of exponential decay:
Freq ~ A * exp ( -t * B )
Proof of work requires the guessing of crypto puzzle, which is a random guessing, which must follow the Binomial distribution. We see here the trail of this distribution with t >> average(t), average is approximately 14 seconds.
It means, that any POW consensys by-design assumes the outages, when the block time due to probabalistic reasons exceed some pre-defined value.
On this diagram, the 140 seconds ( 14 sec avg x 10 factor) lies in the middle, showing quite a lot of blocks, which took more time than that to mine.
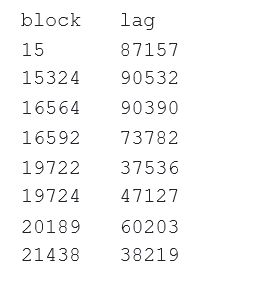
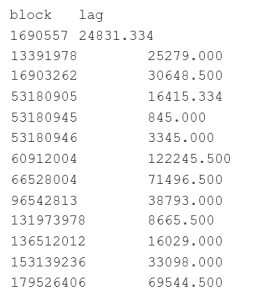
There are also several blocks with the lag exceeding 300 sec
ethereum[(ethereum[‘lag’]>300) & (ethereum[‘block’]<15537393)]
gives us the blocks with extreme block times:
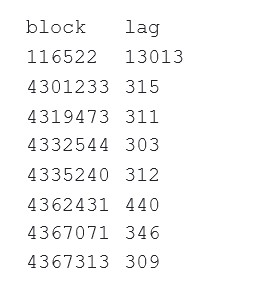
Good news, that all of them well in the past!
Ethereum After POS
The distribution of the block time in Ethereum After POS ( logarithmic frequency scale ):
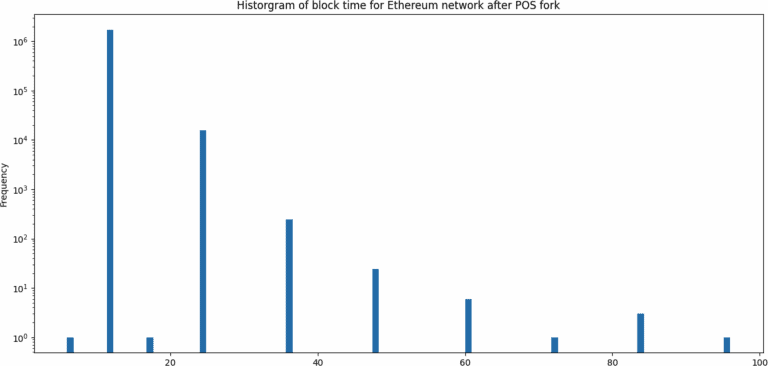
Here we see very discrete histogram, with block times of multiples of 6 and 12 seconds. The maximum time is 96 = 12 * 8, minimum is 6 seconds.
Bitcoin
The distribution of the block time in Bitcoin ( logarithmic frequency scale ):
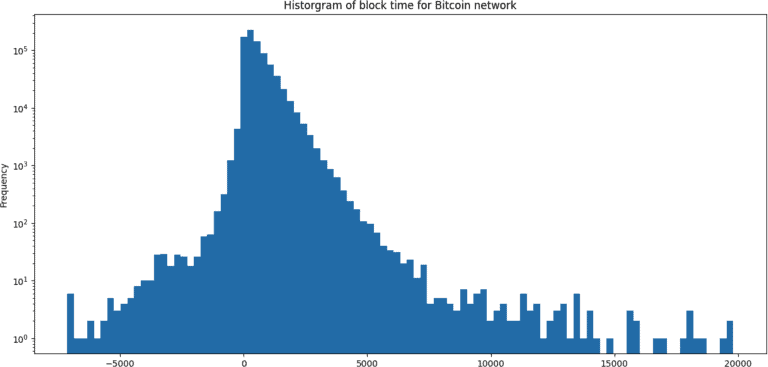
Bitcoin and Ethereum both employ Proof of Work (PoW) for block mining, which contributes to their similar trends towards larger values. Notably, there is a noteworthy negative range of block times. This arises from utilizing the block mining time as a timestamp, rather than the actual time when the block was added to the blockchain. In practice, mining times can be established well before the block’s inclusion in the chain, resulting in a considerable number of blocks with negative time lags.
However, these negative lags should not significantly impact the measurement of block lags in the positive range. This is because their distribution declines much more rapidly than that of positive lags. Among the blocks, there are 151 instances where mining took more than 2 hours, with some taking more than 10 hours.
Note that these are all at the very beginning of the network… good times!
Binance Smart Chain
The distribution of the block time in Binance Smart Chain ( logarithmic frequency scale ):
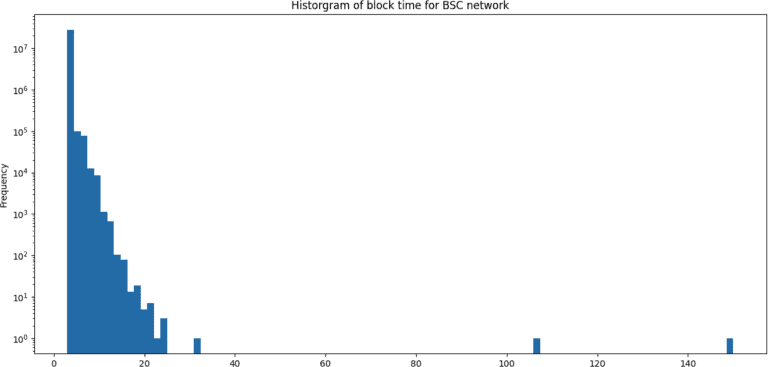
BSC distribution falls pretty fast, and there are no much extremely long block times here.
Solana
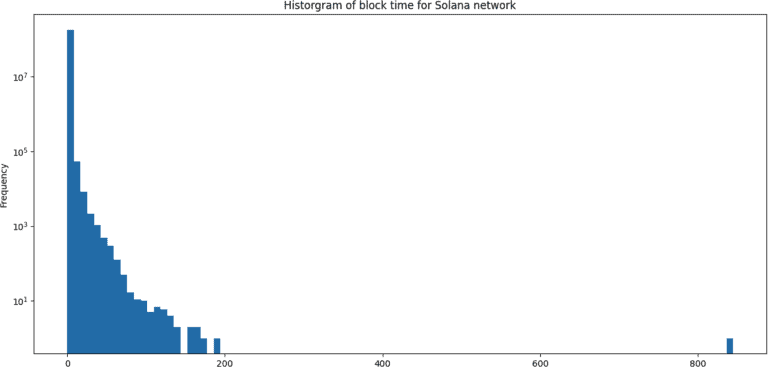
The distribution of the block time in Solana ( logarithmic frequency scale ):
The hystogram in logarithmic scale looks very smooth and has almost linear slope for a range of 10..120 seconds per block.
It can be approximately modeled as of exponential decay:
Freq ~ A * exp ( -t * B )
Proof of work requires the guessing of crypto puzzle, which is a random guessing, which must follow the Binomial distribution. We see here the trail of this distribution with t >> average(t), average is approximately 14 seconds.
It means, that any POW consensys by-design assumes the outages, when the block time due to probabalistic reasons exceed some pre-defined value.
On this diagram, the 140 seconds ( 14 sec avg x 10 factor) lies in the middle, showing quite a lot of blocks, which took more time than that to mine.
There are also several blocks with the lag exceeding 300 sec
ethereum[(ethereum[‘lag’]>300) & (ethereum[‘block’]<15537393)]
gives us the blocks with extreme block times:
Good news, that all of them well in the past!
Ethereum After POS
The distribution of the block time in Ethereum After POS ( logarithmic frequency scale ):
Here we see very discrete histogram, with block times of multiples of 6 and 12 seconds. The maximum time is 96 = 12 * 8, minimum is 6 seconds.
Bitcoin
The distribution of the block time in Bitcoin ( logarithmic frequency scale ):
Bitcoin and Ethereum both employ Proof of Work (PoW) for block mining, which contributes to their similar trends towards larger values. Notably, there is a noteworthy negative range of block times. This arises from utilizing the block mining time as a timestamp, rather than the actual time when the block was added to the blockchain. In practice, mining times can be established well before the block’s inclusion in the chain, resulting in a considerable number of blocks with negative time lags.
However, these negative lags should not significantly impact the measurement of block lags in the positive range. This is because their distribution declines much more rapidly than that of positive lags. Among the blocks, there are 151 instances where mining took more than 2 hours, with some taking more than 10 hours.
Note that these are all at the very beginning of the network… good times!
Binance Smart Chain
The distribution of the block time in Binance Smart Chain ( logarithmic frequency scale ):
BSC distribution falls pretty fast, and there are no much extremely long block times here.
Solana
The distribution of the block time in Solana ( logarithmic frequency scale ):
Solana is famous for the very fast block times… and long outages! These are blocks that took over 10 minutes:
And you see, they are sometimes close to the whole day (!) when the network effectively stalled.
Aggregated Availability Figures
The aggregated figures from the distributions are collected in the following table:
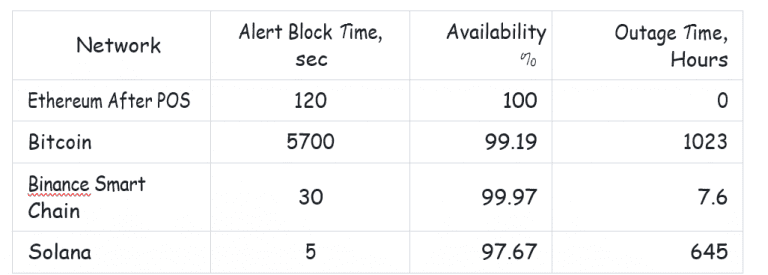
Binance Smart Chain and Ethereum, particularly after the introduction of Proof of Stake (PoS), are highly favored for their exceptional availability, approaching nearly 100%. This level of availability ensures a high degree of predictability in application performance.
On the other hand, Solana, while being one of the fastest networks, exhibits slightly lower availability at 97%. This level of availability is considered inadequate, even for centralized non-redundant systems such as a single-server website.
Data Sets
The data for inter-block lags in seconds versus the block number are quieried from Bitquery datasets for 4 blockchains.
They are available in S3 public :
Jupyter Notebook
Jupyter notebook is in the github project. To run the code, you will need standard Jupyter labs installation, and download the datasets in data folder inside the prject
After that run
% jupyter-lab
and load notebook BlockhainTimes.ipynb
Subscribe to our newsletter
Subscribe and never miss any updates related to our APIs, new developments & latest news etc. Our newsletter is sent once a week on Monday.


