
A Deep Dive into Exchange Whale Ratio with Blockchain Data
Crypto investors and analysts continuously seek metrics to gauge market sentiment, predict price movements, and assess the overall health of various digital assets. One such metric gaining traction is the Exchange Whale Ratio. This blog post aims to delve into what the Exchange Whale Ratio is, its significance, and how to leverage bitquery API to track EWR for different cryptocurrencies.
What is “Exchange Whale Ratio”?
The Exchange Whale Ratio is a metric used to measure the dominance or concentration of large holders, often referred to as "whales" within the cryptocurrency ecosystem. These whales typically represent entities or individuals holding significant amounts of a particular cryptocurrency. The Exchange Whale Ratio specifically focuses on the proportion of total supply held by these large holders that are deposited on exchanges. The mathematical formula for the calculation of EWR is as follows:

Significance of Exchange Whale Ratio
Understanding the Exchange Whale Ratio can provide valuable insights into market dynamics and investor behavior. Here are some key points highlighting its significance:
- Market Sentiment Analysis: A high Exchange Whale Ratio may indicate that a relatively small number of entities holds a large portion of a cryptocurrency's supply. This concentration of wealth can influence market sentiment and potentially impact price movements, as the actions of whales can have a significant effect on market trends.
- Liquidity and Volatility: The Exchange Whale Ratio can also offer insights into liquidity levels within the market. High concentrations of supply held by whales on exchanges may imply increased liquidity, potentially leading to higher trading volumes and reduced price volatility.
- Risk Assessment: For investors and traders, monitoring the Exchange Whale Ratio can aid in assessing the risk associated with a particular cryptocurrency. A high ratio suggests a higher degree of centralization, which could pose risks such as price manipulation or sudden sell-offs by large holders.
Using Bitquery API to compute EWR for various cryptocurrencies
Bitquery indexes data from 40+ blockchains and provides GraphQL APIs and additional interfaces, including WebSocket. To find the “Exchange Whale Ratio” we can leverage the Bitquery Token Holder APIs.
In this blog, we will find EWR for some altcoins like Shibainu, Link, and Matic and try to do a comparison using graphs.
Finding Exchange Whale Ratio for Shiba Inu
The SHIBA INU (SHIB) Token on Ethereum mainnet has token address - “0x95ad61b0a150d79219dcf64e1e6cc01f0b64c4ce”. This is needed to find the transitions specific to this token.
How to Calculate Exchange Inflows?
In the context of cryptocurrency trading, inflow to exchanges typically refers to the amount of cryptocurrency being transferred from personal wallets to exchange wallets. This inflow indicates users' intent to trade, sell, or participate in other exchange-based activities.
For example, I want to find the Inflow of only the “Shiba Inu” token which is listed on the Ethereum blockchain, How to find it?
Here, to get the inflow which is nothing but the trades of the token we leverage Bitquery DexTrades API.
The query below retrieves the total sum of transactions of Shiba Inu (SHIB) for the last 72 Hours i.e. 13th May to 15th May.
{
  ethereum(network: ethereum) {
    dexTrades(
      date: {before: "2024-05-16", after: "2024-05-12"}
      baseCurrency: {is: "0x95ad61b0a150d79219dcf64e1e6cc01f0b64c4ce"}
    ) {
      count
      tradeAmount(in: USD, calculate: sum)
    }
  }
}
Now, Using another query we can retrieve the top 10 exchange inflow transactions of Shiba Inu token in the same 72-hour period.
{
  ethereum(network: ethereum) {
    dexTrades(
      options: {limit: 10, desc: "tradeAmount"}
      date: {before: "2024-05-16", after: "2024-05-12"}
      baseCurrency: {is: "0x95ad61b0a150d79219dcf64e1e6cc01f0b64c4ce"}
    ) {
      count
      tradeAmount(in: USD)
      timeInterval {
        hour(count: 1)
      }
    }
  }
}
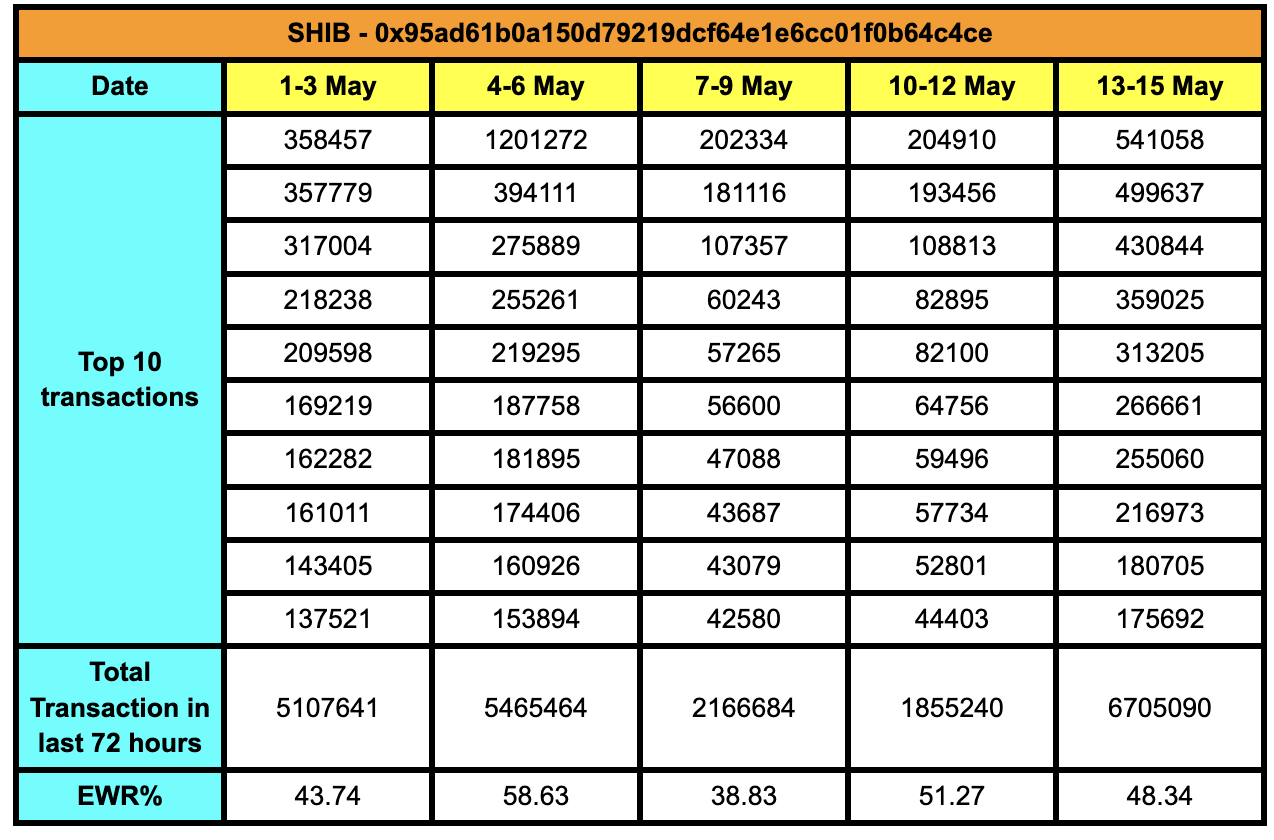
Using the above queries for the last 15 days, the below table is formed the EWR of the SHIB token.
Finding Exchange Whale Ratio for LINK
The ChainLink Token (LINK) Token on Ethereum mainnet has a token address - “0x514910771af9ca656af840dff83e8264ecf986ca”. This is needed to find the transitions specific to this token.
The query below retrieves the total sum of transactions of Chainlink (LINK) for the last 72 Hours i.e. 13th May to 15th May.
{
  ethereum(network: ethereum) {
    dexTrades(
      date: {before: "2024-05-16", after: "2024-05-12"}
      baseCurrency: {is: "0x514910771af9ca656af840dff83e8264ecf986ca"}
    ) {
      count
      tradeAmount(in: USD, calculate: sum)
    }
  }
}
Now, Using another query we can retrieve the top 10 inflow transactions of LINK token in the same 72-hour period.
{
  ethereum(network: ethereum) {
    dexTrades(
      options: {limit: 10, desc: "tradeAmount"}
      date: {before: "2024-05-16", after: "2024-05-12"}
      baseCurrency: {is: "0x514910771af9ca656af840dff83e8264ecf986ca"}
    ) {
      count
      tradeAmount(in: USD)
      timeInterval {
        hour(count: 1)
      }
    }
  }
}
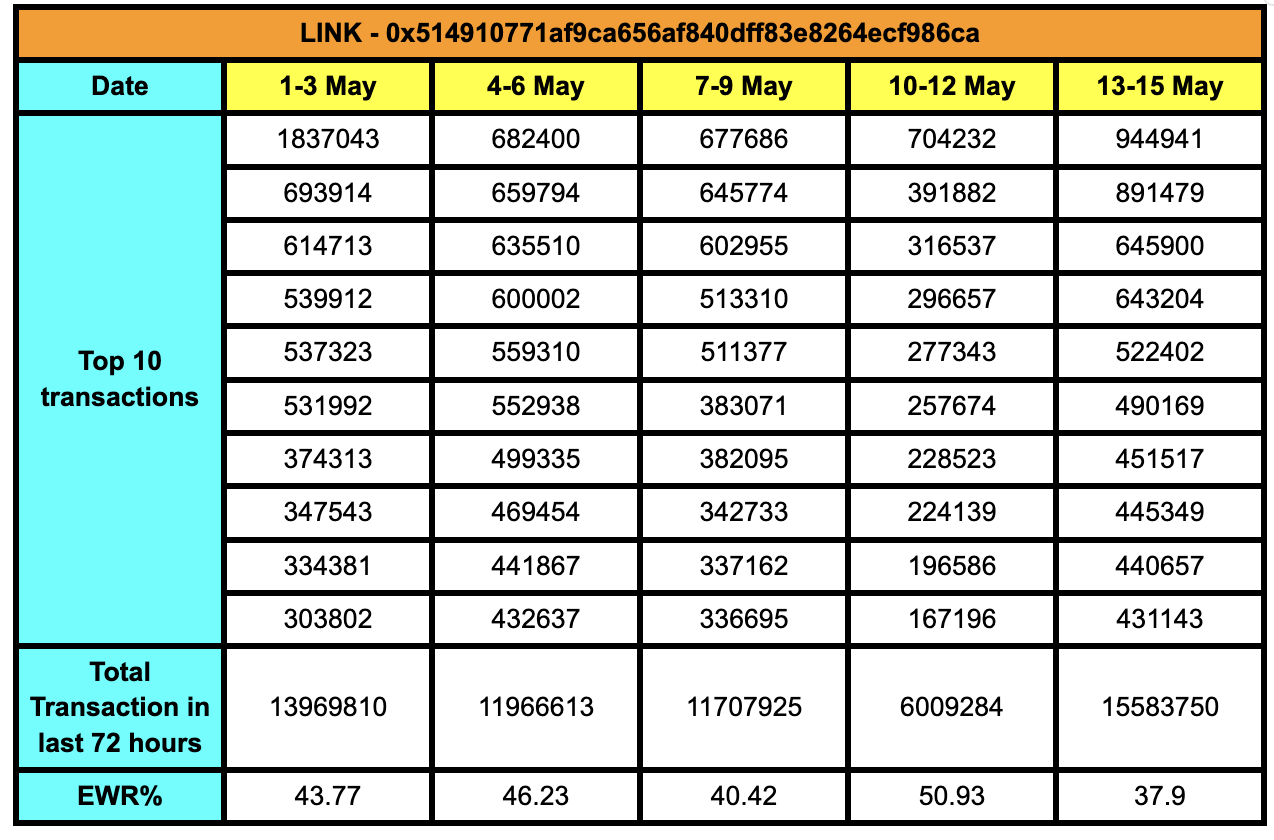
Using the above queries for the last 15 days, the below table is formed for the EWR of the LINK token.
Finding Exchange Whale Ratio for MATIC
The Matic Token (MATIC) Token on Ethereum mainnet has token address - “0x7d1afa7b718fb893db30a3abc0cfc608aacfebb0”. This is needed to find the transitions specific to this token.
The query below retrieves the total sum of transactions of Polygon Matic (MATIC) for the last 72 Hours i.e. 13th May to 15th May.
{
  ethereum(network: ethereum) {
    dexTrades(
      date: {before: "2024-05-16", after: "2024-05-12"}
      baseCurrency: {is: "0x7d1afa7b718fb893db30a3abc0cfc608aacfebb0"}
    ) {
      count
      tradeAmount(in: USD, calculate: sum)
    }
  }
}
Now, Using another query we can retrieve the top 10 inflow transactions of MATIC token in the same 72-hour period.
{
  ethereum(network: ethereum) {
    dexTrades(
      options: {limit: 10, desc: "tradeAmount"}
      date: {before: "2024-05-16", after: "2024-05-12"}
      baseCurrency: {is: "0x7d1afa7b718fb893db30a3abc0cfc608aacfebb0"}
    ) {
      count
      tradeAmount(in: USD)
      timeInterval {
        hour(count: 1)
      }
    }
  }
}
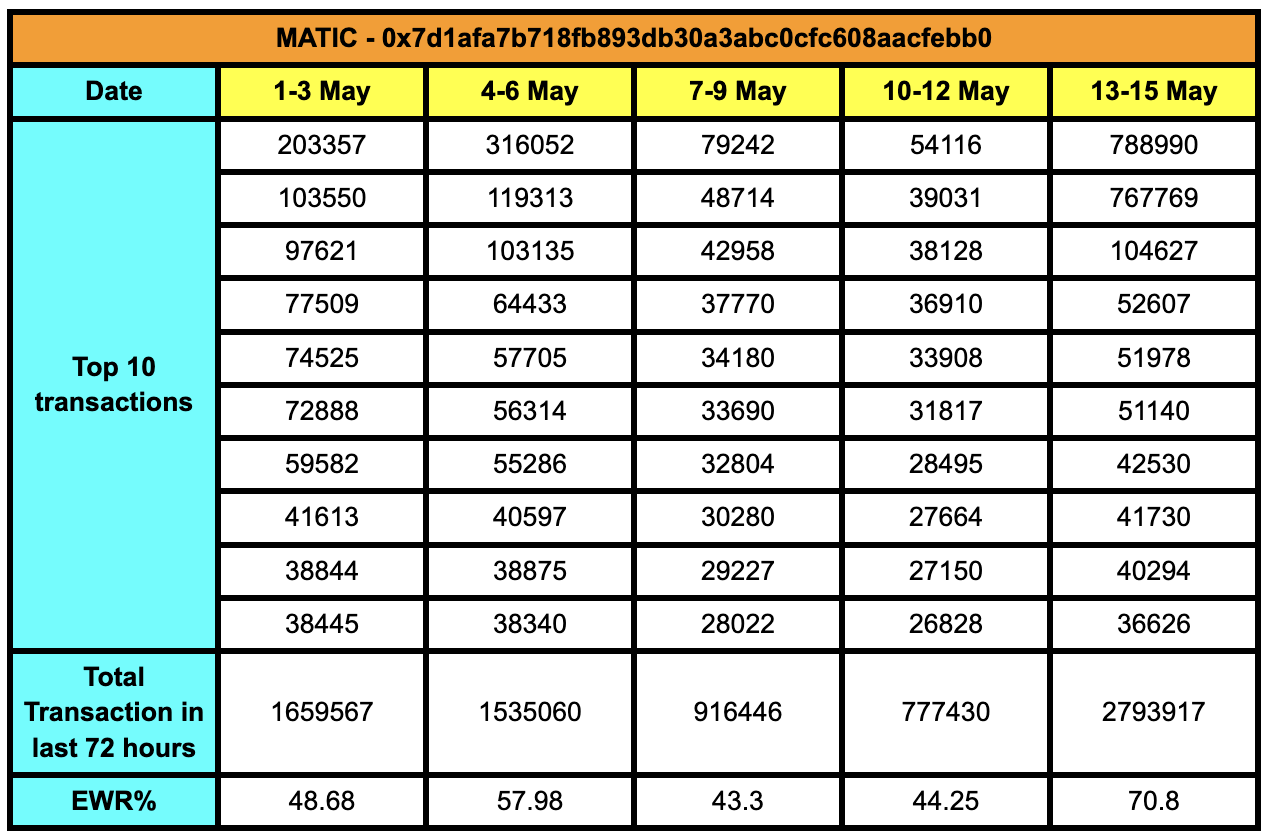
Using the above queries for the last 15 days, the below table is formed for the EWR of the MATIC token.
Visual Comparison of EWR across Cryptocurrencies
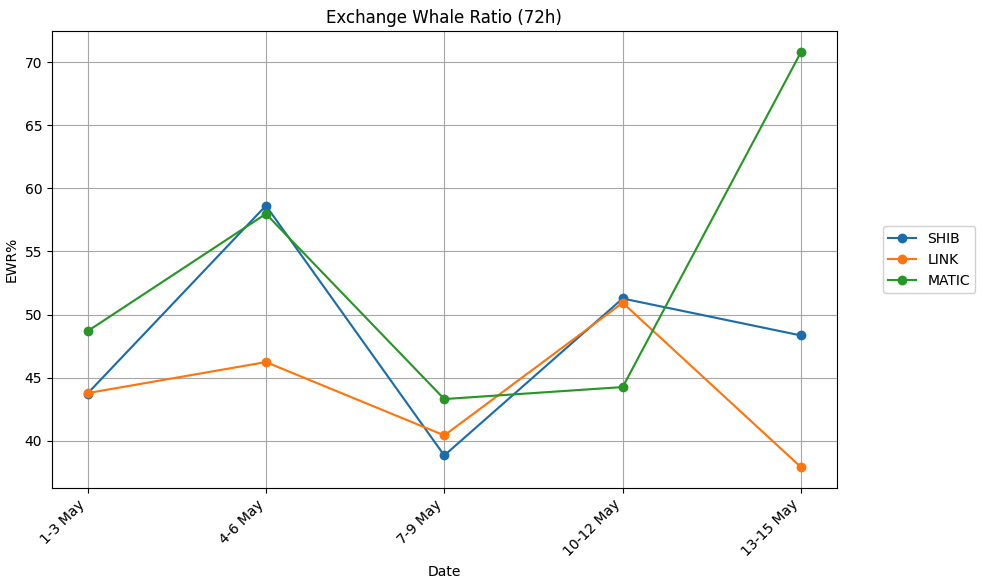
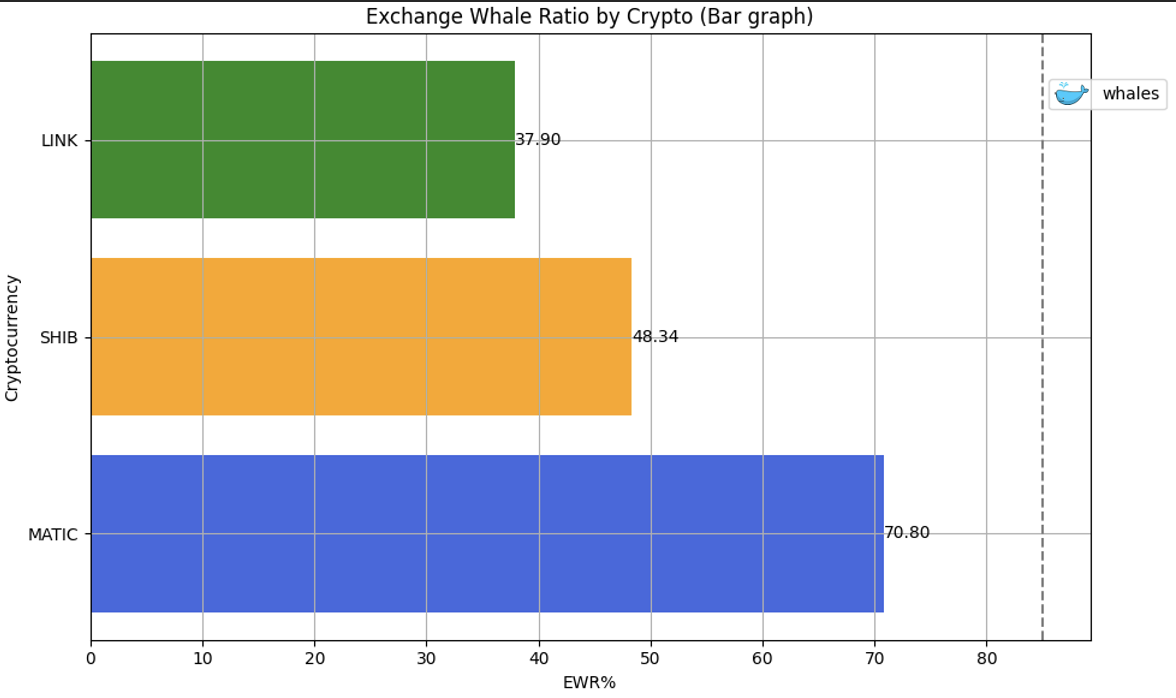
The above graph was created using Python Code which can be run on Google Colab, also the data is fetched using Bitquery API and can be found here.
Conclusion
The Exchange Whale Ratio serves as a valuable metric for assessing the concentration of wealth within the cryptocurrency ecosystem and understanding its implications for market dynamics. While it provides useful insights, it's essential to consider other factors such as trading volume, market sentiment, and fundamental analysis when making investment decisions.
As the cryptocurrency market continues to evolve, the Exchange Whale Ratio, along with other metrics, will remain a crucial tool for investors, analysts, and enthusiasts alike to navigate the complexities of this burgeoning asset class. Understanding and monitoring these metrics can contribute to more informed decision-making and a deeper understanding of cryptocurrency markets.
The information provided in this material is published solely for educational and informational purposes. It does not constitute a legal, financial audit, accounting, or investment advice. The article's content is based on the author's own research and, understanding and reasoning. The mention of specific companies, tokens, currencies, groups, or individuals does not imply any endorsement, affiliation, or association with them and is not intended to accuse any person of any crime, violation, or misdemeanor. The reader is strongly advised to conduct their own research and consult with qualified professionals before making any investment decisions. Bitquery shall not be liable for any losses or damages arising from the use of this material.
--
Paid Guest Post Written by Pranshu Agrawal
Subscribe to our newsletter
Subscribe and never miss any updates related to our APIs, new developments & latest news etc. Our newsletter is sent once a week on Monday.


