
Evaluating Token Success: Holder Patterns and Price Changes Post-Launch
Initial Coin Offerings (ICOs) are the crypto equivalent of Initial Public Offerings (IPOs). It’s a method of fundraising capital for early-stage crypto projects. A firm looking to raise funds to create a DApp or offer web3 services can raise them through ICO. An offering where investors can buy to receive the new tokens that represent a stake in the company.
In ICO, blockchain-based startups mint a predetermined quantity of their native digital token and sell them to early investors in exchange for other crypto tokens such as Ethereum, Bitcoin, BNB, and stablecoins like USDT, USDC, or DAI. Unlike IPOs, it’s easier to make sizable profits through ICOs.
A proper example of making a sizable profit through ICO was an event that occurred in 2023. According to @lookonchain’s post on X, this wallet that participated in the Ethereum ICO moved their investment after lying dormant for eight years and an over 611,000% increase.

On the other hand, ICOs are also risky — any token sold through an ICO is considered a high-risk investment. The market is under-regulated. So, scam ICOs are rife, and investors have no protections if an ICO fails or turns out to be fraudulent.
A December 2022 report on ICOs by MDPI%20exhibited%20scam%20accusations.) revealed that about 56% of all ICOs reviewed exhibited scam accusations.
Over the years, ICOs have become less popular because of the legal gray area around the offerings. But even so, tokens are still deployed and sold every day.
According to the data retrieved from the Ethereum blockchain with Bitquery’s Smart Contract API, 63,315 ERC20 token smart contracts were deployed year to date. That’s an average of 523 ERC20 tokens released every single day!
So, even if ICOs are no longer popular, tokens are still deployed daily. And more so, the risk of scams is still high—though not as high as before. However, the best way to mitigate the risk of buying into scams is to analyze tokens.
However, apart from the risk of buying into scams…
Why Should You Learn to Analyze Tokens?
Here are the importance of analyzing newly launched tokens.
- Risk assessment: Crypto launch is under-regulated and very risky. Anybody, even those with ulterior motives, can decide to deploy a smart contract and launch a token anytime without being checked. Analyzing tokens allows investors to evaluate the potential risk associated with the token, such as the project credibility, market trends, investors' and traders' sentiments, and market volatility.
- Due Diligence: Analyzing a token lets you perform your due diligence before investing. You learn about the token supply, tokenomics (token economy), the roadmap, the team behind the token, and the transparency and security level of the deployed contracts. Conducting due diligence helps you avoid the likelihood of scams and ensure transparency.
- Long-Term Viability: Learning the fundamentals of a token helps gauge your investment. Checking the use cases, community support, scalability, and the project's roadmap gives you insight into the future outlook of the token. This also allows you to gauge the viability and the potential token growth.
- Reward Potential: Analyzing a new token gives you access to helpful information to learn more about your investment. Analyzing the project utility, market demand, tokenomics, and so on will provide you with insights into the reward potential of investing in this token.
Becoming a profitable on-chain investor or trader requires you to have early access to helpful information before anyone else. One of the ways is learning how to retrieve needed data from the blockchain with data analytic tools like Bitquery.
Bitquery is a blockchain analytics company that focuses on retrieving, parsing, and indexing blockchain data for analysis. It offers a suite of APIs that simplifies the process of retrieving data from the blockchain. And with this data, you can gain usable insight to make intelligent investment decisions.
In this article, we’ll walk you through ways to analyze newly launched tokens and gain insight from the data. Read on to learn about how to draw meaningful insights from blockchain data. Before that, let’s learn the key metrics for drawing insights from the blockchain.
Analyzing the Top Newly Launched Tokens on the Ethereum Blockchain
In this section, we’ll walk you through the process of analyzing newly launched crypto tokens using the Bitquery APIs. Here, we'll do an exploratory analysis of some newly launched tokens based on the token holders and Uniswap liquidity.
For this analysis, we’ll be using the dex Trade API, the Token Holders API, and the Transfers API.
-
ELON
Elon smart contract was deployed to the Ethereum blockchain on the 24th of April 2024 on block 19,723,619.
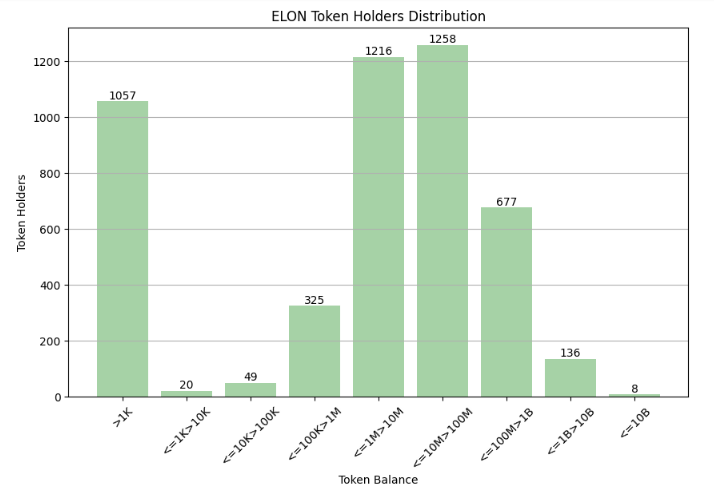
Token Holder Distribution
-
It has a total supply of over 690 billion Elon and an FDV of $12 million.
-
According to the data retrieved using the Bitquery Token Holder’s API, Elon has just 4,735 unique token holders with an average of 6,275,181 ELON per wallet address.
-
Based on our analysis using the Bitquery API, eight unique wallets are sitting on over 23% of the total token supply.
Trading Activity After Deployment
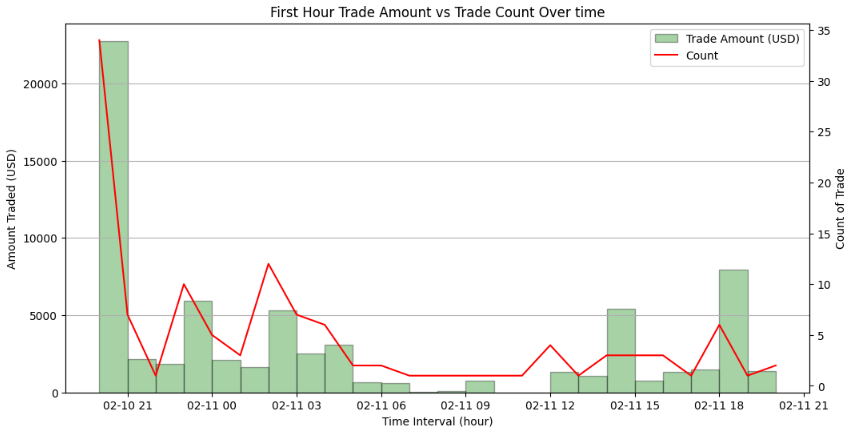
Looking into the Uniswap liquidity using the dex trade API, Elon has deep liquidity when compared to other tokens launched around the same period. With total DEX trade transactions of 65,314 and a total token transfer of 113,420, Elon is considered highly liquid. A unique sender and receiver of 7,869 and 10,238 respectively.
.PNG)
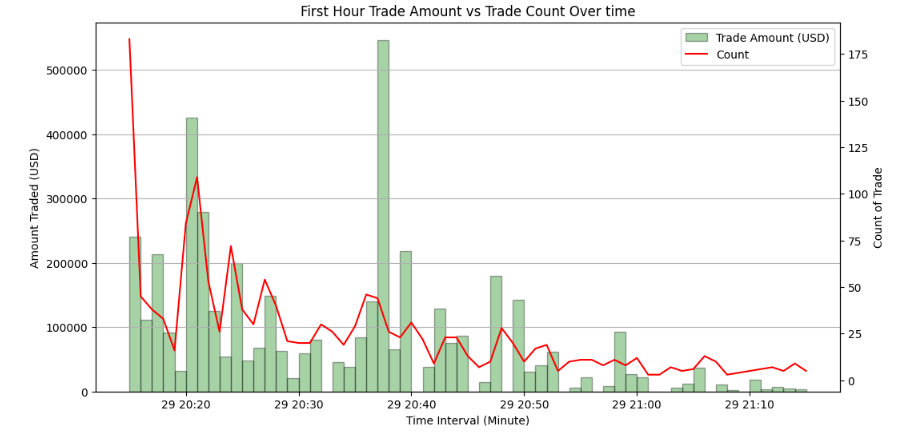
The charts above give insight into the first trading hour on Uniswap DEX. Looking into the chart,
-
the first few minutes of trades showed heavy trading traffic.
-
For example, an average of about $12,000 was traded in the first 10 minutes, showing an enthusiasm that usually follows the deployment of new tokens on DEXes.
-
As time went on, the enthusiasm continued to dwindle and the amount traded on the Uniswap DEX was reduced by around 41% by the end of the first trading hour.
However, there was little reflection on the price chart. In that, the changes that we saw in the trading volume and amount traded have little effect on the token price within the first hour of trade. The lowest quote price within the hour is just 4.95e-9 (0.00000000495) per WETH, while the highest quote price over the same period was 6.21e-9 (0.00000000621) per WETH and the Average quote price traded is 5.68e-9 (0.00000000568) per WETH.
.PNG)
Trading Activity Over Time
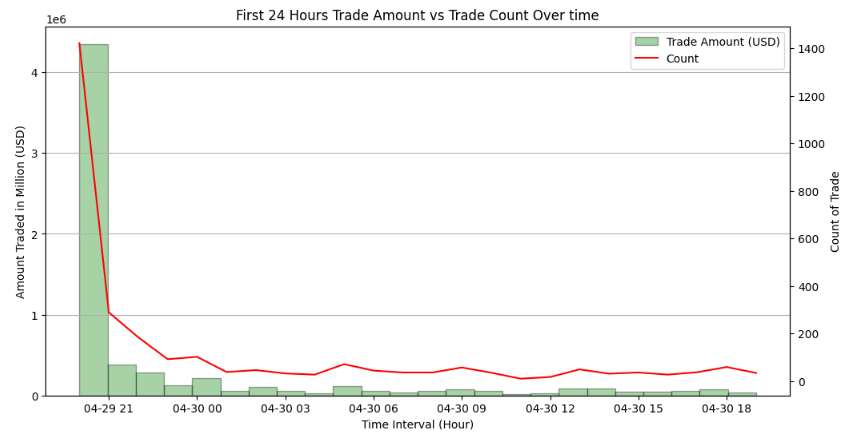
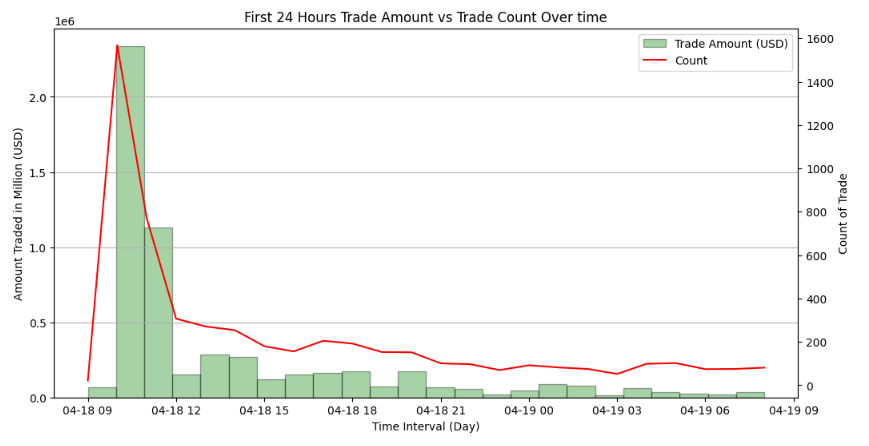
While the first chart gives us a detailed overview of what happened in the first hour, a better way to draw insight from on-chain data is to zoom out and check the trend over time. Looking into the data above, we discovered that our analysis of the first chart doesn’t reflect what happened over the next 24 hours.
-
After the first two hours of deployment, the traders/investors’ activities increased significantly.
-
From less than $1M traded in the first two hours, the amount traded peaked in the fifth hour at about $7M, about 1,200% change, before trending down over subsequent hours.
Alternatively, the trade volume on the Uniswap DEX also followed the same pattern as the amount traded.
-
From just 500 transactions in the first two hours, it peaked to at over 2500 trades in the fifth hour,
-
Before trending back down to under 500 trades in the 24th hour, which signifies a roll of emotions among the traders/investors.
Finally, unlike in the first-hour chart above, there were some significant changes between the price chart and the Volume/Traded Amount chart. Price changes also reflect some kind of increase or decrease in trading volume, signifying some kind of speculative move among the token traders.
For example, when there was a significant drop in price on the 10th hour, there was a significant increase in the amount traded and the count of trade on the Volume/Traded Amount Chart. This could signify that the speculators are trying to sell their holdings and reduce loss.
.PNG)
.PNG)
Zooming further out into the daily activities of ELON traders on Uniswap DEX, we even have a more different insight to draw from the chart above.
-
There were about 20,000 trades initiated with over $40 million moving around on UniSwap on the first trading day.
-
Over the next six days, we saw a significant decline in the amount traded and the trade volume.
-
However, on the seventh day, there was about a 150% increase in trading activities, signifying changing investors’ sentiment concerning the token.
In conclusion, considering the number of senders/receivers to the unique transactions count on-chain, the velocity of transfer is high. Leaving us to conclude that ELON is traded by speculators who want to make the most of the investment just like any other meme token. And if you’re looking to invest for the long term, it’s important to be careful of token manipulation as eight accounts are sitting on 23% of the total market capitalization of the token which makes it easier to manipulate the market price of the token.
Overall, there seems to be no volatility issue from the look of things as the on-chain liquidity is significantly high. Although ELON is a meme that is known for price volatility, it is not a pump-and-dump token from the look of things.
-
Three Protocol Token (THREE)
Three protocol is another new Ethereum token that was just deployed on the Ethereum chain. The token was deployed about 11 days ago at the time of this writing.
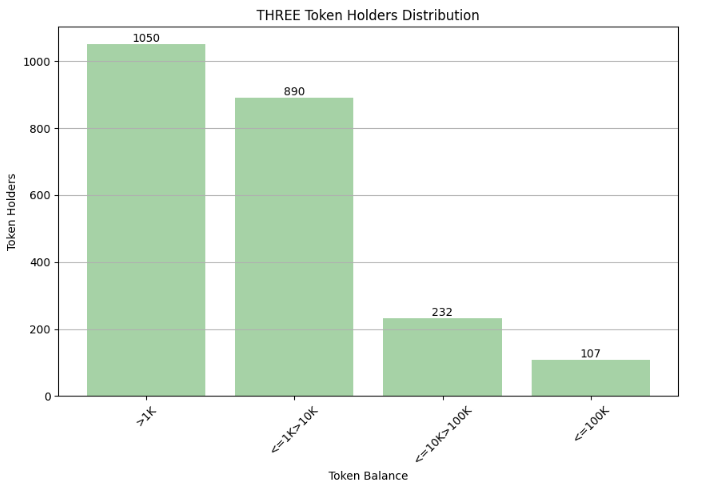
Token Holder Distribution
-
With over 13,000 unique transactions on the Uniswap DEX and a total transfer of about 22,500, the token seems to have enough volume to avoid volatility.
-
There are 2,279 unique token holders with a total supply of 100 million tokens minted.
Trading Activity After Deployment
Looking at the token holders’ distribution chart above, we can see that the token has some kind of decentralized distribution that will prevent market manipulation by nefarious individuals. THREE seems to be an interesting token to dive deep into. So, let’s analyze the price action over the first seven days after contract deployment.
A look at the chart above revealed that although THREE has a lower transaction volume, there is some kind of enthusiasm that comes with other token launches.
-
The minimum amount traded within the first hour was about $80 and the maximum amount traded was about $546,403.
-
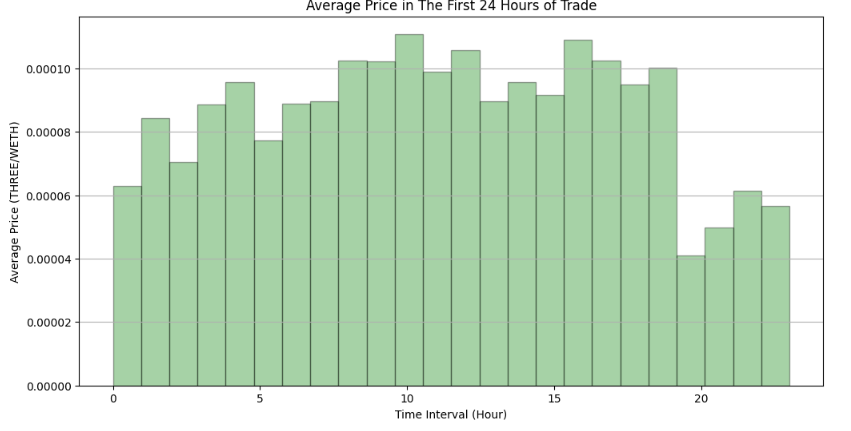
Likewise, looking at the price chart, except for some outliers, the price of the token seems fairly consistent with a minimum quoted price of 0.000071 THREE/WETH and a maximum of 0.000103 THREE/ETH.
Looking at the 24-hour chart above, the first hour showed a heavy volume.
-
The count of trade was over 1400 transactions. This also reflects on the amount traded which is also over $4 million.
-
However, in the second hour, the trading volume and amount traded declined by about 80% to under 200 trade counts and $1 million respectively.
-
One insight to draw from this chart is that the highest percentage of people who buy into the token are in for the quick bucks.
The price chart seems to do the opposite of what we expect based on the traded amount and trade count chart.
- For example, instead of trending down, the price of the token seems to consistently rise until it reaches its highest of 0.000041THREE/WETH at the tenth hour before trending back down.
Trading Activity Overtime

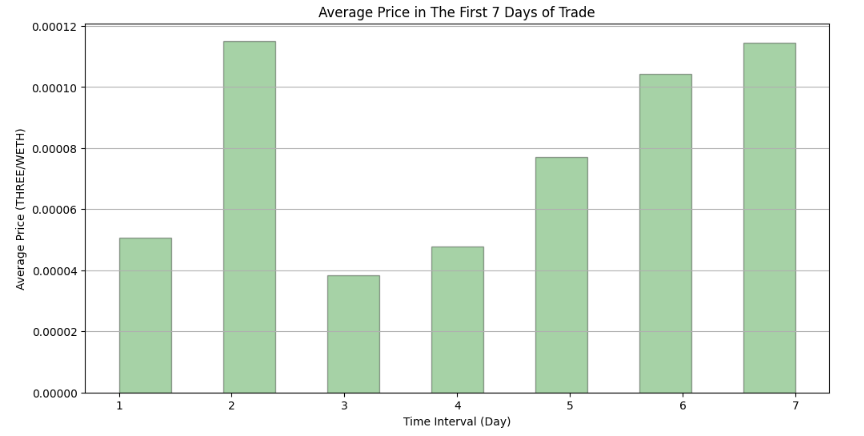
A further look into the 7-day chart gives us a different view of what’s going on with the token on-chain.
-
The first day of trade saw over $5 million in traded volume and about 2000 transactions conducted on Uniswap DEX.
-
Looking further, there was about an 80% decline on the second day in the traded amount and trading volume, which could be a result of people trying to make a profit from the significant price change.
-
Over the next couple of days, there was a consistent price increase, which seemed to affect the trade volume and traded amount.
In conclusion, while the first four charts leave us with the conclusion that THREE seem to be traded by speculators, the seven-day chart left us with a different outlook — the token looks stable with a better outlook. Moreover, the tokens were distributed among holders in a way that avoids manipulation and the trading activities in the first few days have been stable and consistent.
-
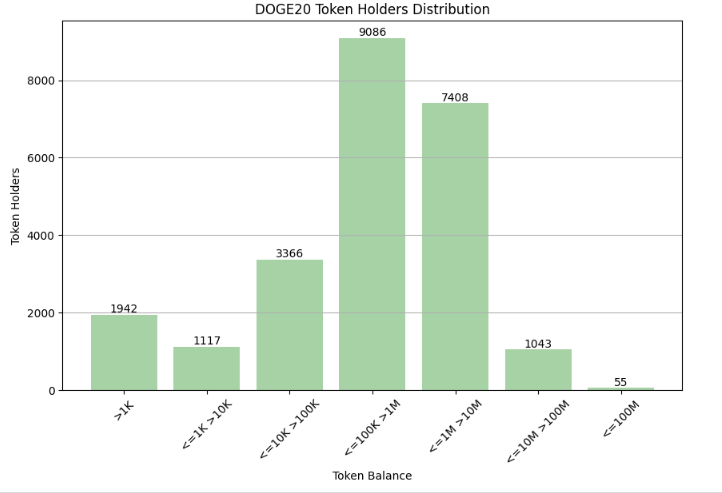
DogeCoin20 (DOGE20)
DOGE20 is a new ERC20 token deployed on Ethereum Blockchain.
Token Holder Distribution
-
It has a total supply of 140 billion tokens and a unique holder count of 22,564 with over 149,000 transactions conducted.
-
Throughout its existence, there were 13,427 senders and 33,652 receivers of the token on the Uniswap DEX.
Trading Activity After Deployment
As a meme token (based on the total token supply), the distribution of the token seems to be fairly even based on the chart above. Let’s look further into the price chart.
DOGE20 seems to be different from other tokens we’ve looked into.
-
The first minute of trade has a low trading volume and the amount traded.
-
Over the next 60 minutes trading volume averaged at 26 with a consistent trading volume.
-
Looking at the price chart, the quoted price of the token remains consistent over the timeframe.
Even though DOGE20 is a meme token, it has fairly consistent UniSwap trading activities in the first 60 minutes.

It seems that after speculators saw the stability of the token in the first 60 minutes, they jumped on the train in the next hour.
- After a low start, the activities of the token jumped about 20x in the second hour, from under 200 trades and $500 thousand amount traded to over 1600 transactions and $2 million, before trending back down over the next 24 hours.
Trading Activity Over Time
The daily chart above gives us insight into how activities went over the next couple of days.
-
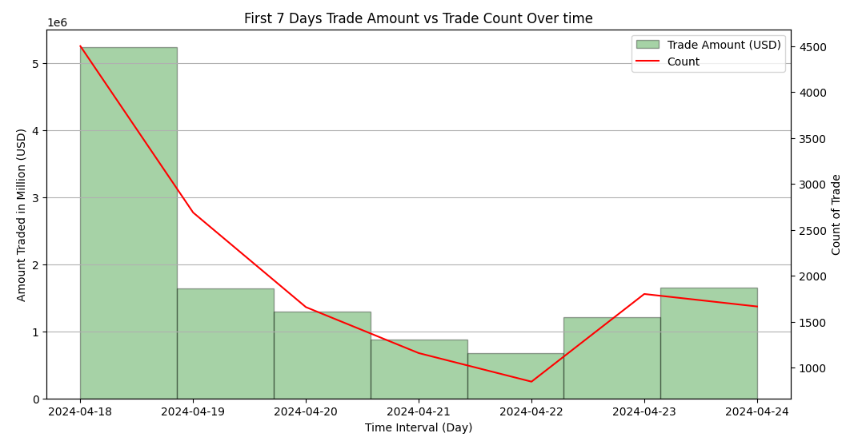
After over $5 million was traded on the first day, the token DEX activity saw a decline over the next couple of days before trending back up from the fifth day.
-
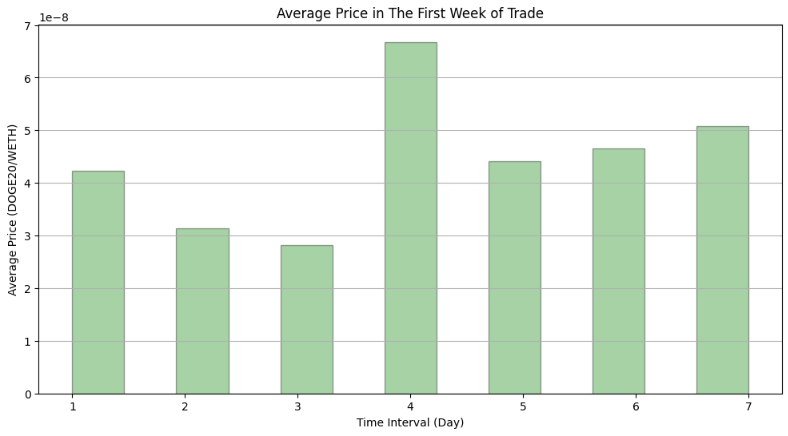
From the price chart, we saw that the minimum quote price was on the third day with a quoted price of 0.000000028 DOGE20/WETH and the maximum quote price was on the fourth day with a price of 0.0000000668 DOGE20/WETH.
-
Maga VP
Maga-VP (MVP) is a satirical token for Donald Trump’s MAGA (Make America Great Again) campaign.
Token Holder Distribution
-
It has 50 million tokens deployed with 2.5 million tokens burned.
-
As of the time of this writing, there were 875 token holders with over 7000 in total transactions on the Uniswap DEX.
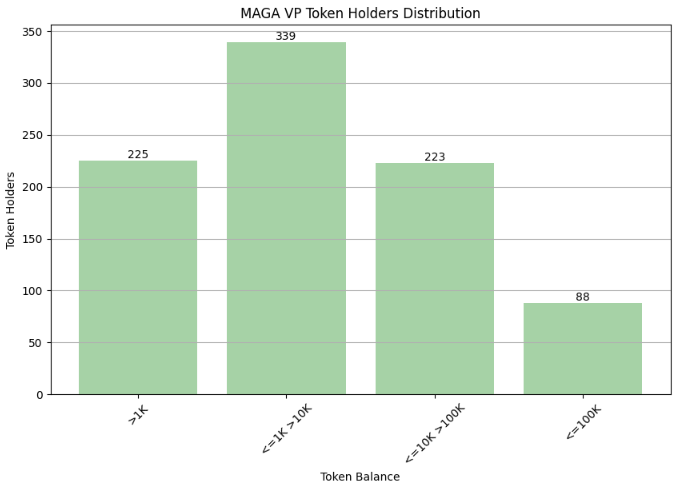
Even though MVP is just a satirical token, it is well distributed among the 875 holders. The highest group of holders were averagely holding between 1,000 and 10,000 tokens. And just 88 unique addresses hold more than 100 thousand tokens.
Trading Activity After Deployment
A look at the charts above gives us insight into the trading volume, the amount traded, and price action on the Uniswap exchange.
-
The token started trading on-chain at 0.000037MVP/WETH and saw a decline of about 36% to its lowest of 0.000024 on the 60th minute.
-
On the other hand, the trading activities were very low to the amount traded, which showed that only a few people were speculating on the price.

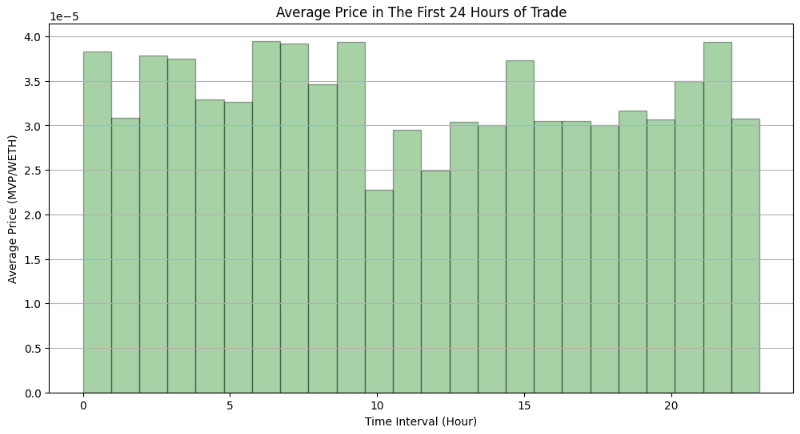
Looking further into the hourly price chart, MVP also has fairly consistent pricing over the next 24 hours.
-
The token started trading at 0.000038 MVP/WETH and saw about an 18% decline in quote price to about 0.000031MVP/WETH.
-
Looking into the activity chart above, the token has low on-chain activities in general.
Trading Activity Over Time
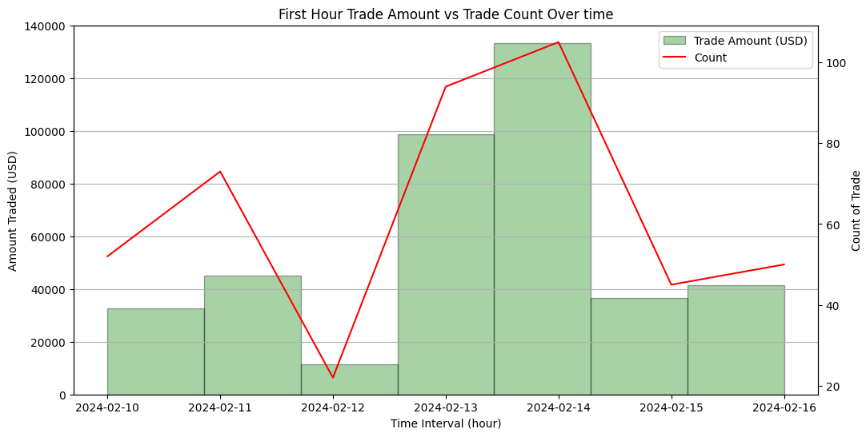

The daily price chart is congruent with the other chart in the sense that the price decline continues over the next few days with a few outliers.
- The token traded at its highest of 0.0000347MVP/WETH on the first day and traded at its lowest of 0.0000291MVP/WETH on the seventh day seeing a decline of around 11%.
The activity chart seems to be different from what we saw on the previous charts.
-
Starting at around 55 trades and $37,000 in traded amount on the first day and ending the week a little above 50 trades and $42,000 in trade amount.
-
However, there are a couple of activities that happened throughout the week. On the fourth day, the Uniswap activity was 10x.
-
It also increased by a couple of percent on the fifth day too before declining by about 80%.
-
Bonk on ETH (BONK)
Bonk on ETH is another newly launched token on the Ethereum blockchain. It started trading on the Uniswap DEX on May 1, 2024.
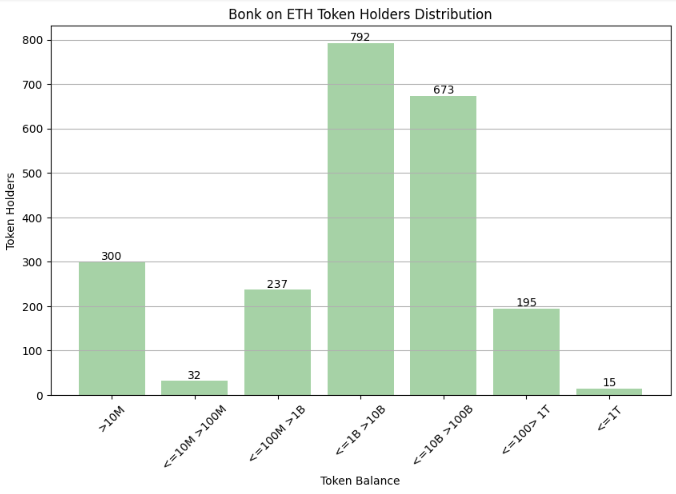
Token Holder Distribution
Based on the data retrieved using Bitquery APIs,
-
BONK has a total supply of 100 trillion and unique token holders of 2,248.
-
Additionally, there are over 19,000 transactions on Uniswap, with 2,466 unique token senders and 3,750 token receivers.
-
Based on the chart below, we can see that 15 wallets control about 20% of the total supply of BONKs.
-
Moreover, the highest category of BONK holders are between the 1 to 10 billion bonks category.
Here is a chart to visualize the unique holder distributions of the token.
Trading Activity After Deployment
Let’s go through the price action, trading volume, and amount traded chart to gain insight into how the Bonk token is faring after the token deployment.
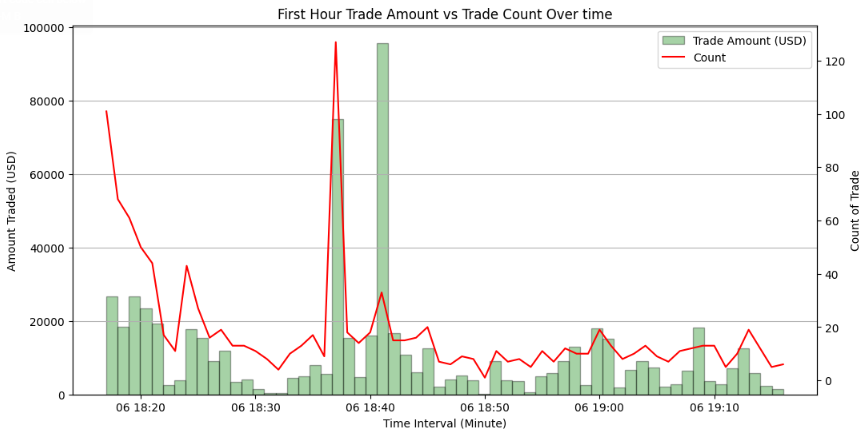
Looking at the price chart above, the token seems to be fairly stable than what’s normally expected from Memecoins. Apart from a few movements, the price seems stable over the first 60 minutes.
-
The minimum average quoted price over the period was 0.0000000000044 BONK/WETH and the maximum price quoted was 0.0000000000058 BONK/WETH over the same period, a 24% price change.
-
Moreover, an average of 18 trades were conducted on the Uniswap DEX every minute for 60 minutes.

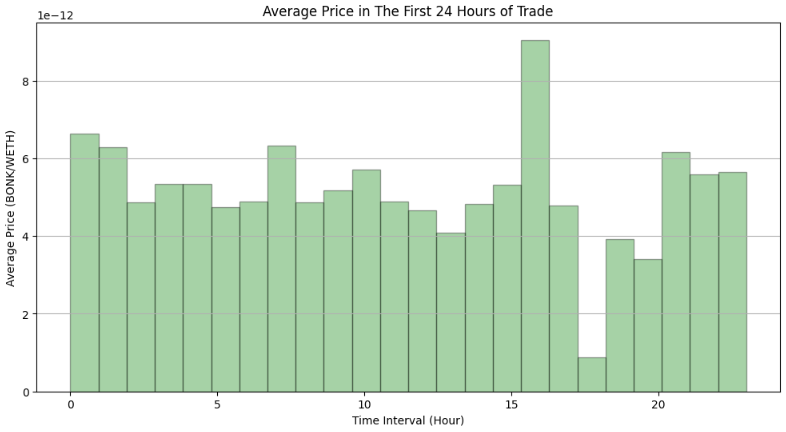
Apart from the significant price change on the 16th and the 18th-hour bar, the token price is congruent with what we saw on the first 60-minute chart.
-
Moreover, the token saw a high transaction count in the first few hours before trending down over the next 24 hours.
-
An average of 363 trades were conducted hourly over the 24 hours with the maximum and minimum trade counts being 1,309 and 89 respectively.
Trading Activity Over Time
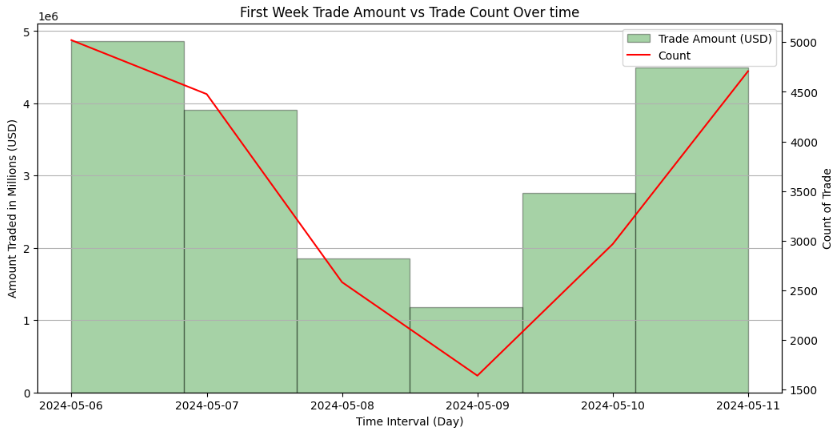
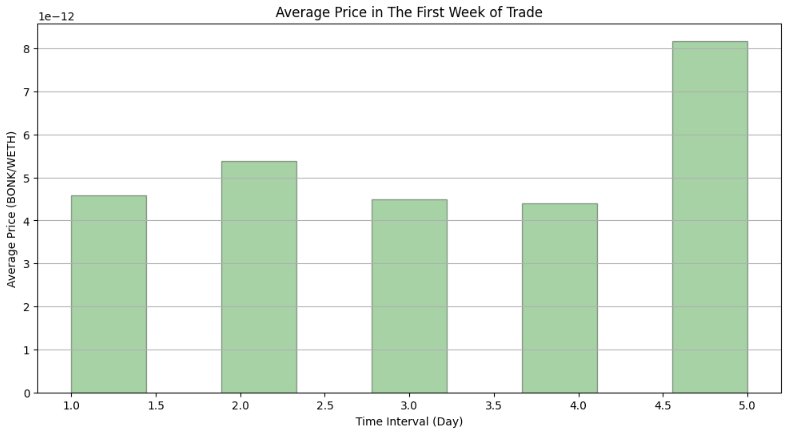
Unlike the previous charts, the daily chart gives us a deep insight into how the token fared over the first seven days.
- Based on the price chart, the token started the trading week at a quoted price of 0.0000000000045BONK/WETH and ended the week on a high note at 0.0000000000082 BONK/WETH, an 86% increase.
-
Looking at the transaction count, about $5 million was traded in 5000 transactions on the first day of deployment.
-
Over the next couple of days, the trade volume saw a steady decline both in transaction volume and traded amount.
-
After the fourth day, there was a turn around and the transaction volume and traded amount saw an uptrend on the next couple of trades.
Though a meme token, BONK seems to have a potential for profit making over the next couple of weeks as the token seems to be gaining popularity among on-chain traders based on the chart above.
Six Key Metrics for Token Analysis
It’s one thing to know how to retrieve data from the blockchain; it’s another thing to understand how to interpret the data and draw meaningful insights from it. Here are key metrics every on-chain analysts, investors, and traders use to analyze and draw meaningful insight from blockchain data.
-
Total New Wallets for Each Token
This metric refers to the count of unique addresses/accounts created to hold the token within a specified time frame. This is a cumulative count of newly created wallets associated with the token over some time. Each wallet represents an entity/user account within the blockchain network that holds the particular token.
The total new wallets for each token metric provide insight into the adoption and popularity of a particular token among investors, traders, and on-chain users. The metric gives insight into the token's or project's adoption level and interest. It also reflects the growth of the user base and increasing activities in the ecosystem.
With this, you can assess market trends, investors' sentiments, and potential for network expansion, which would contribute to understanding the token's performance and relevance in the crypto market.
-
Token Price
Price reflects market demand, investors' sentiment, and the perceived value of the token. When assessing a new token, price indicates the initial market acceptance or resistance and the token’s potential for growth.
Patterns and trends affect market analysis. A rising token price indicates market reception and token growth potential. It suggests strong demand and investor confidence, potentially attracting more attention.
For example, price trending down could signal investors are losing interest in the token's utility and security/market viability. When you compare the token price to the listing price, you gain insight into the performance of the token sales/ICO/IDOs.
Note: Price shouldn’t be analyzed as a standalone metric, i.e., it should complement other metrics like trading volume, market capitalization, tokenomics, and other fundamentals.
-
Market Capitalization
Market Capitalization (MC) is the total value of all circulating tokens for a given crypto token. It provides a numerical snapshot of its standing in a broader market and also reflects the token's value. MC is determined by multiplying the circulating supply of the token by the current price of the token in USD.
i.e.
MC = Circulating supply x Token Price (USD)
MC lets you assess the token’s risk profile and indicate the crypto’s liquidity — the ease at which the token can be traded for other crypto assets or fiat currency.
This metric helps to measure and gauge a crypto token's dominance and popularity. And it reflects the popularity of a token over the long term. It reflects the importance of the token in terms of the investors’ optimism and pessimism.
A token with a high market cap is usually seen as a more solid/trustworthy token that provides confidence for investors and shareholders. While a low market cap token faces skepticism about growth that impedes adoption and investors’ trust.
Moreover, high market cap tokens are more stable and less volatile because they often have more liquidity (more buyers and sellers), reducing price fluctuation and market manipulation. They also indicate that the token has a strong community, a solid development team, and widespread adoption. So, they are perceived as legitimate and trustworthy.
MC provides valuable insight into token size, stability, and potential impact on the market. To get the best of MC, it should be cross-analyzed with the other metrics.
-
Fully Diluted Valuation (FDV)
FDV is used to calculate the total theoretical value of a crypto token if the total token supplied is in circulation at the current price. With the FDV, investors understand the overall/maximum market capitalization a token could achieve if all are in circulation. It helps investors understand the total dilution of the value when maximum supply is reached. This metric is relevant for tokens with ongoing release and inflation mechanisms.
When the FDV is compared with the market cap, investors can assess the potential for future growth or dilution of a token. A higher FDV to market capitalization indicates growth potential. So, most investors see the token as undervalued. A low FDV to market capitalization indicates limited growth potential or the token is overvalued, which raises concerns about the potential dilution.
Overall, this metric affects investors' sentiments by providing a clear overview of the token potential value. It also helps to analyze if the project launch or presale is under or overvalued to determine investment strategy.
-
Total Token Transfers
The total token transfer metric is the total volume/quantity of tokens transferred by different addresses/wallets in a certain period. It measures the activity level and movement of the particular token in the ecosystem. It’s used to analyze the distribution of transfers across different wallet addresses. For example, large transfers between wallets held by exchanges, whales, or major stakeholders can signal significant market movements of investors’ activities.
A high token transfer indicates increased trading/usage activities and a low transfer metric indicates reduced activity around the token. High volume and frequent transfer indicate active trading/usage of the token.
Moreover, it can also indicate usage or the purpose of use. High transfer can indicate speculative trading or holdings. Comparing the token with similar tokens in the ecosystem can provide contexts and help identify trends and outliers. You would also gain an understanding of the market dynamics around the token.
-
Total Token Holders Metrics
This metric is the number of unique addresses/entities holding a particular token. It’s used for gauging the level of decentralization and token distribution among investors. A high token holder indicates broader ownership and resistance to market manipulation. It also suggests a broad support community.
Monitoring changes in the total number of token holders over time gives you insight into whether the project supports the ethos of web3, which is decentralization. A decentralized distribution across significant holder counts indicates a healthier ecosystem and stability.
A high number of holders suggest growing adoption of the token and resistance to market manipulation. A lower count of token holders can indicate a red flag, which could suggest a waning interest and a shift in investors’ sentiments.
Then, what’s the significance of a growing token holder base?
Token holders metric gives insight into decentralization level, market stability, and high community engagement. A robust holder base will correlate with a vibrant and engaged community.
A growing token holder also indicates perceived value, which signals increasing interest and confidence in the project, and this influences attractiveness to investors and users alike.
What’s Next?
With this analysis, we show a real-world demonstration of how to conduct an on-chain analysis on any token. The on-chain analysis gives you insight into tokens you don’t even know have a community behind them.
For example, looking back at our token holder analysis, we discovered that Elon(ELON) and Dogecoin20 (DOGE20), even though they are meme coins, are well distributed among the holders, which helps prevent manipulations. Also, price-wise, the tokens seem to be stable with little volatility.
As a crypto investor, trader, or analyst, it’s also important to know that the blockchain industry is a dynamic niche, so it requires continuous assessment and analysis of tokens to stay atop of information. With this, you can continue to make informed decisions based on the current situation of things in the industry.
The information provided in this material is published solely for educational and informational purposes. It does not constitute a legal, financial audit, accounting, or investment advice. The article's content is based on the author's own research and, understanding and reasoning. The mention of specific companies, tokens, currencies, groups, or individuals does not imply any endorsement, affiliation, or association with them and is not intended to accuse any person of any crime, violation, or misdemeanor. The reader is strongly advised to conduct their own research and consult with qualified professionals before making any investment decisions. Bitquery shall not be liable for any losses or damages arising from the use of this material.
--
Written by Emmanuel M
Subscribe to our newsletter
Subscribe and never miss any updates related to our APIs, new developments & latest news etc. Our newsletter is sent once a week on Monday.


