USDC vs USDT: Analyzing On-Chain Activities with the Token Holders API
If you want a deeper understanding of token holders for a specific token through their on-chain activities, Bitquery has introduced the Token Holders API. This API allows developers to access data related to token holders and the activities of individual token holders for a given token. In this article, we will dive into our Token Holders API and explore the interesting questions that it can help us address.
In order to understand the data it offers and its practical applications, we will pose some questions about the token holders of USDC and USDT. We will then try to answer these questions using the data retrieved from the Token Holders API. Sounds interesting? Let's dive in!
Key Insights
- 3 million more wallets hold USDT compared to USDC.
- Over the last month, USDC gained more than 13k holders. While USDT gained holders at the start and end of the month, in total USDT lost around 15k holders.
- The number of wallets liquidating USDC and USDT holdings on daily basis peaked at ~15k and ~47k wallets, respectively.
- Daily spending using USDC over the past month peaked at more than $8 billion, which is $2.5 billion more than USDT's peak for the same period.
Token Holder Activity
We can talk about which token is better, USDT or USDC, what their advantages and disadvantages are, or any narrative that is running in the ecosystem about which token is better, but the on-chain activity of people tells us more than anything else. Let’s explore some data points to figure out what people are doing instead of what they are talking about.
Which token do people prefer in general?
We can answer this by getting how many users hold each of the tokens on-chain. Let’s write a query to do the same. We will use the Token Holders API. First, specify the smart contract and get unique token holders with a balance above 0. You also need to set the date to what you want.
{
  USDT: EVM(dataset: archive, network: eth) {
    TokenHolders(
      date: "2023-10-21"
      tokenSmartContract: "0xdAC17F958D2ee523a2206206994597C13D831ec7"
      where: {Balance: {Amount: {gt: "0"}}}
    ) {
      uniq(of: Holder_Address)
    }
  }
  USDC: EVM(dataset: archive, network: eth) {
    TokenHolders(
      date: "2023-10-21"
      tokenSmartContract: "0xA0b86991c6218b36c1d19D4a2e9Eb0cE3606eB48"
      where: {Balance: {Amount: {gt: "0"}}}
    ) {
      uniq(of: Holder_Address)
    }
  }
}
You can run this query in the IDE. Let’s see what data this query returns.
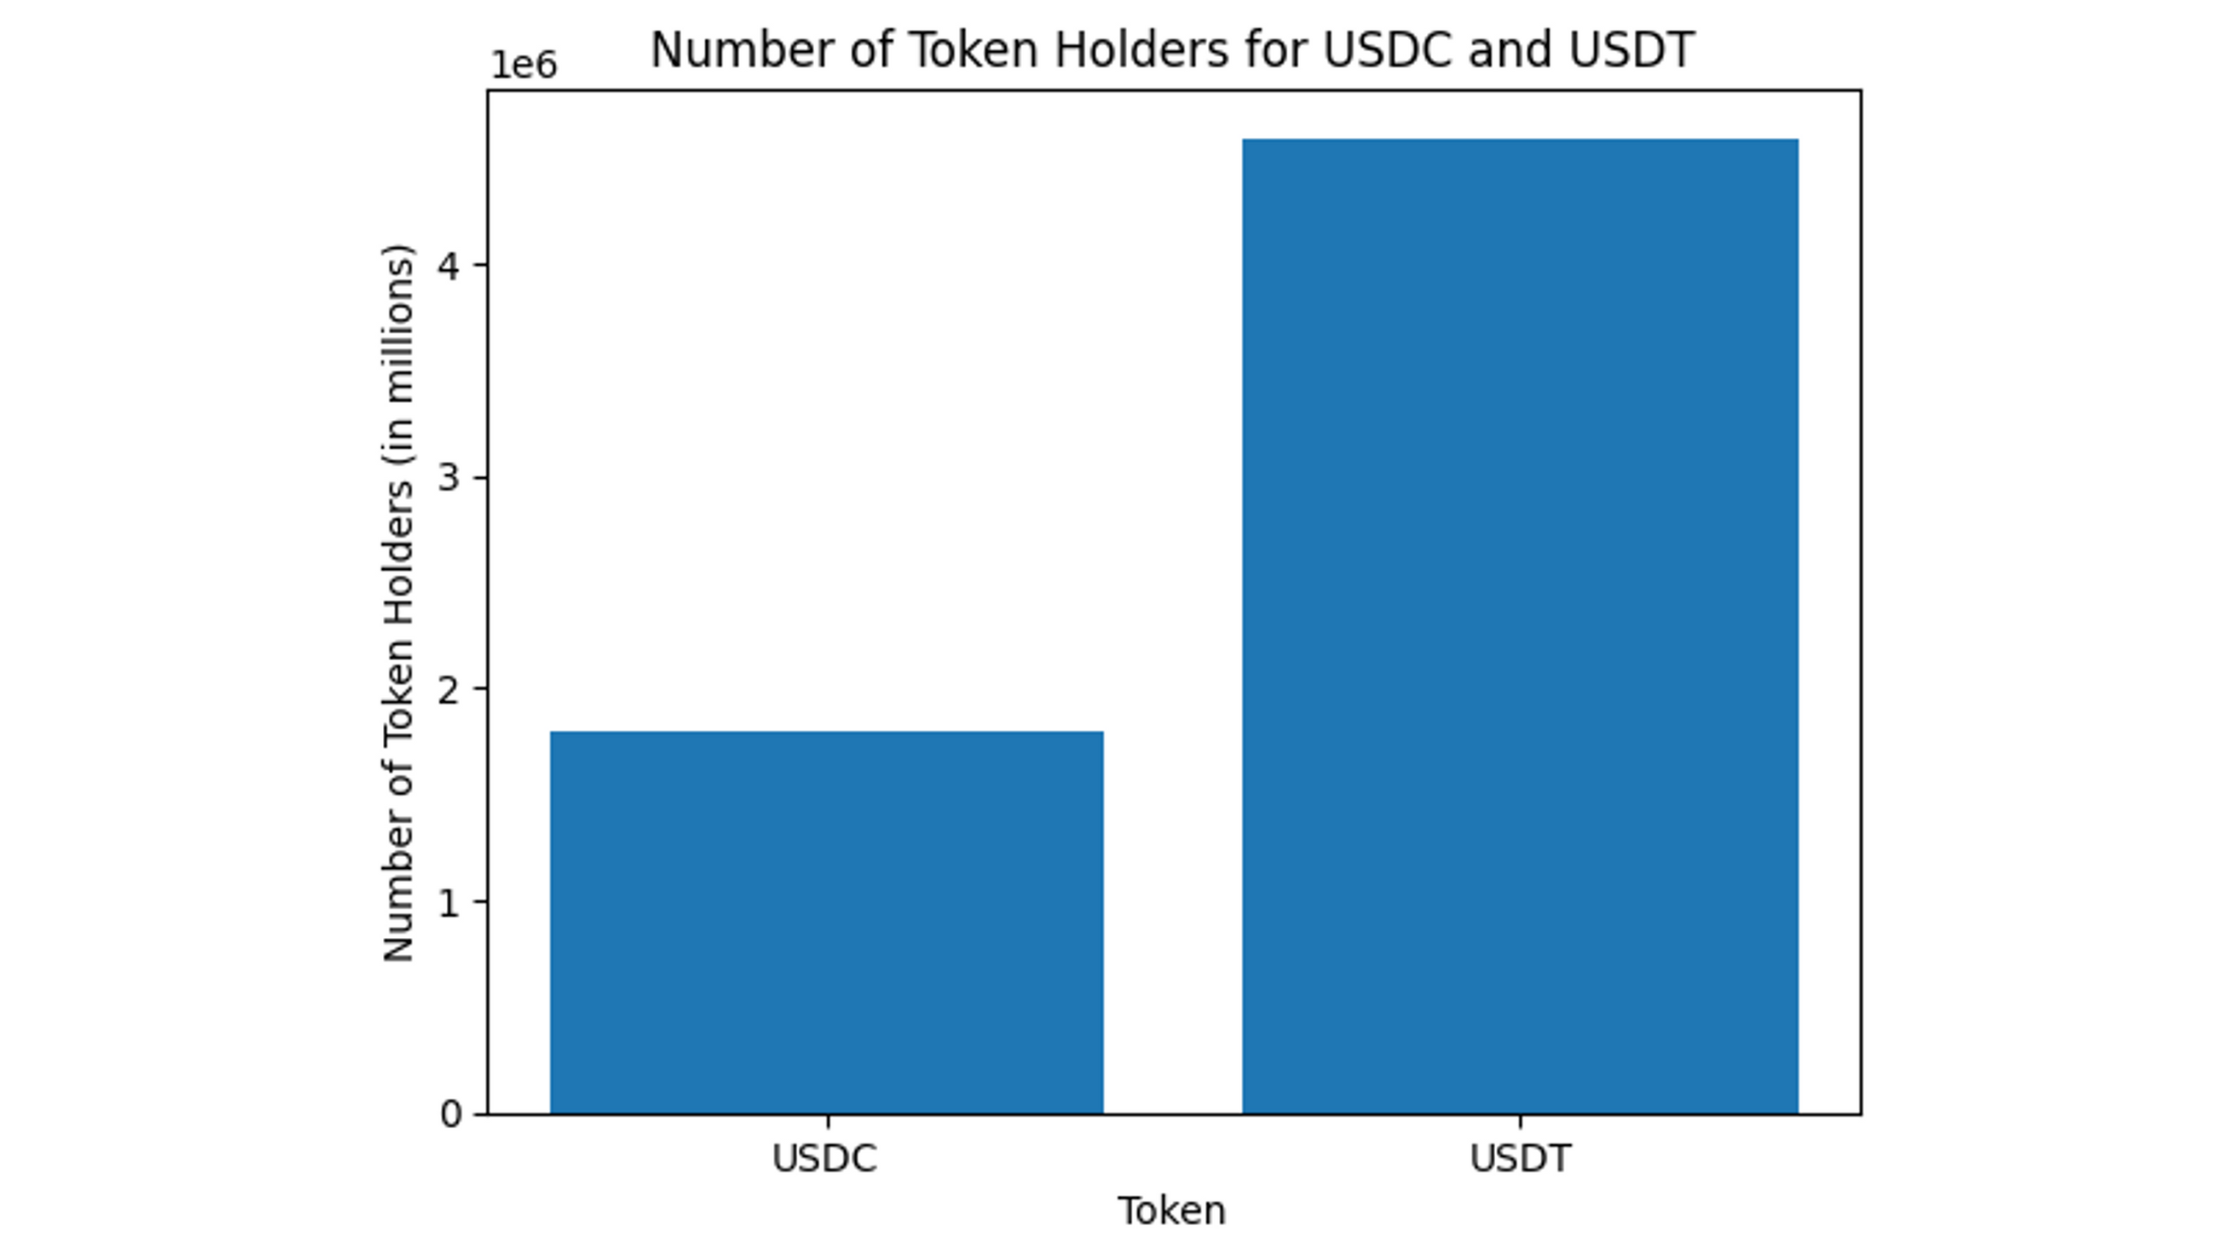
As we can see, there are about 1.797 million holders of USDC and more than 4.591 million holders of USDT. A lot more people are holding USDT compared to USDC.
This can also be because USDT was launched in 2014 and USDC came around in 2018. Just how many people hold a particular token doesn’t give us the whole picture.
What is token holder change over a month?
Many users of both of these tokens understand what’s happening with holders; we can see if there has been an increase in the number of token holders for both of the tokens over the past month. To get token holder data for last month, we need to use the same query as above, but we need to iterate on each day of the month.
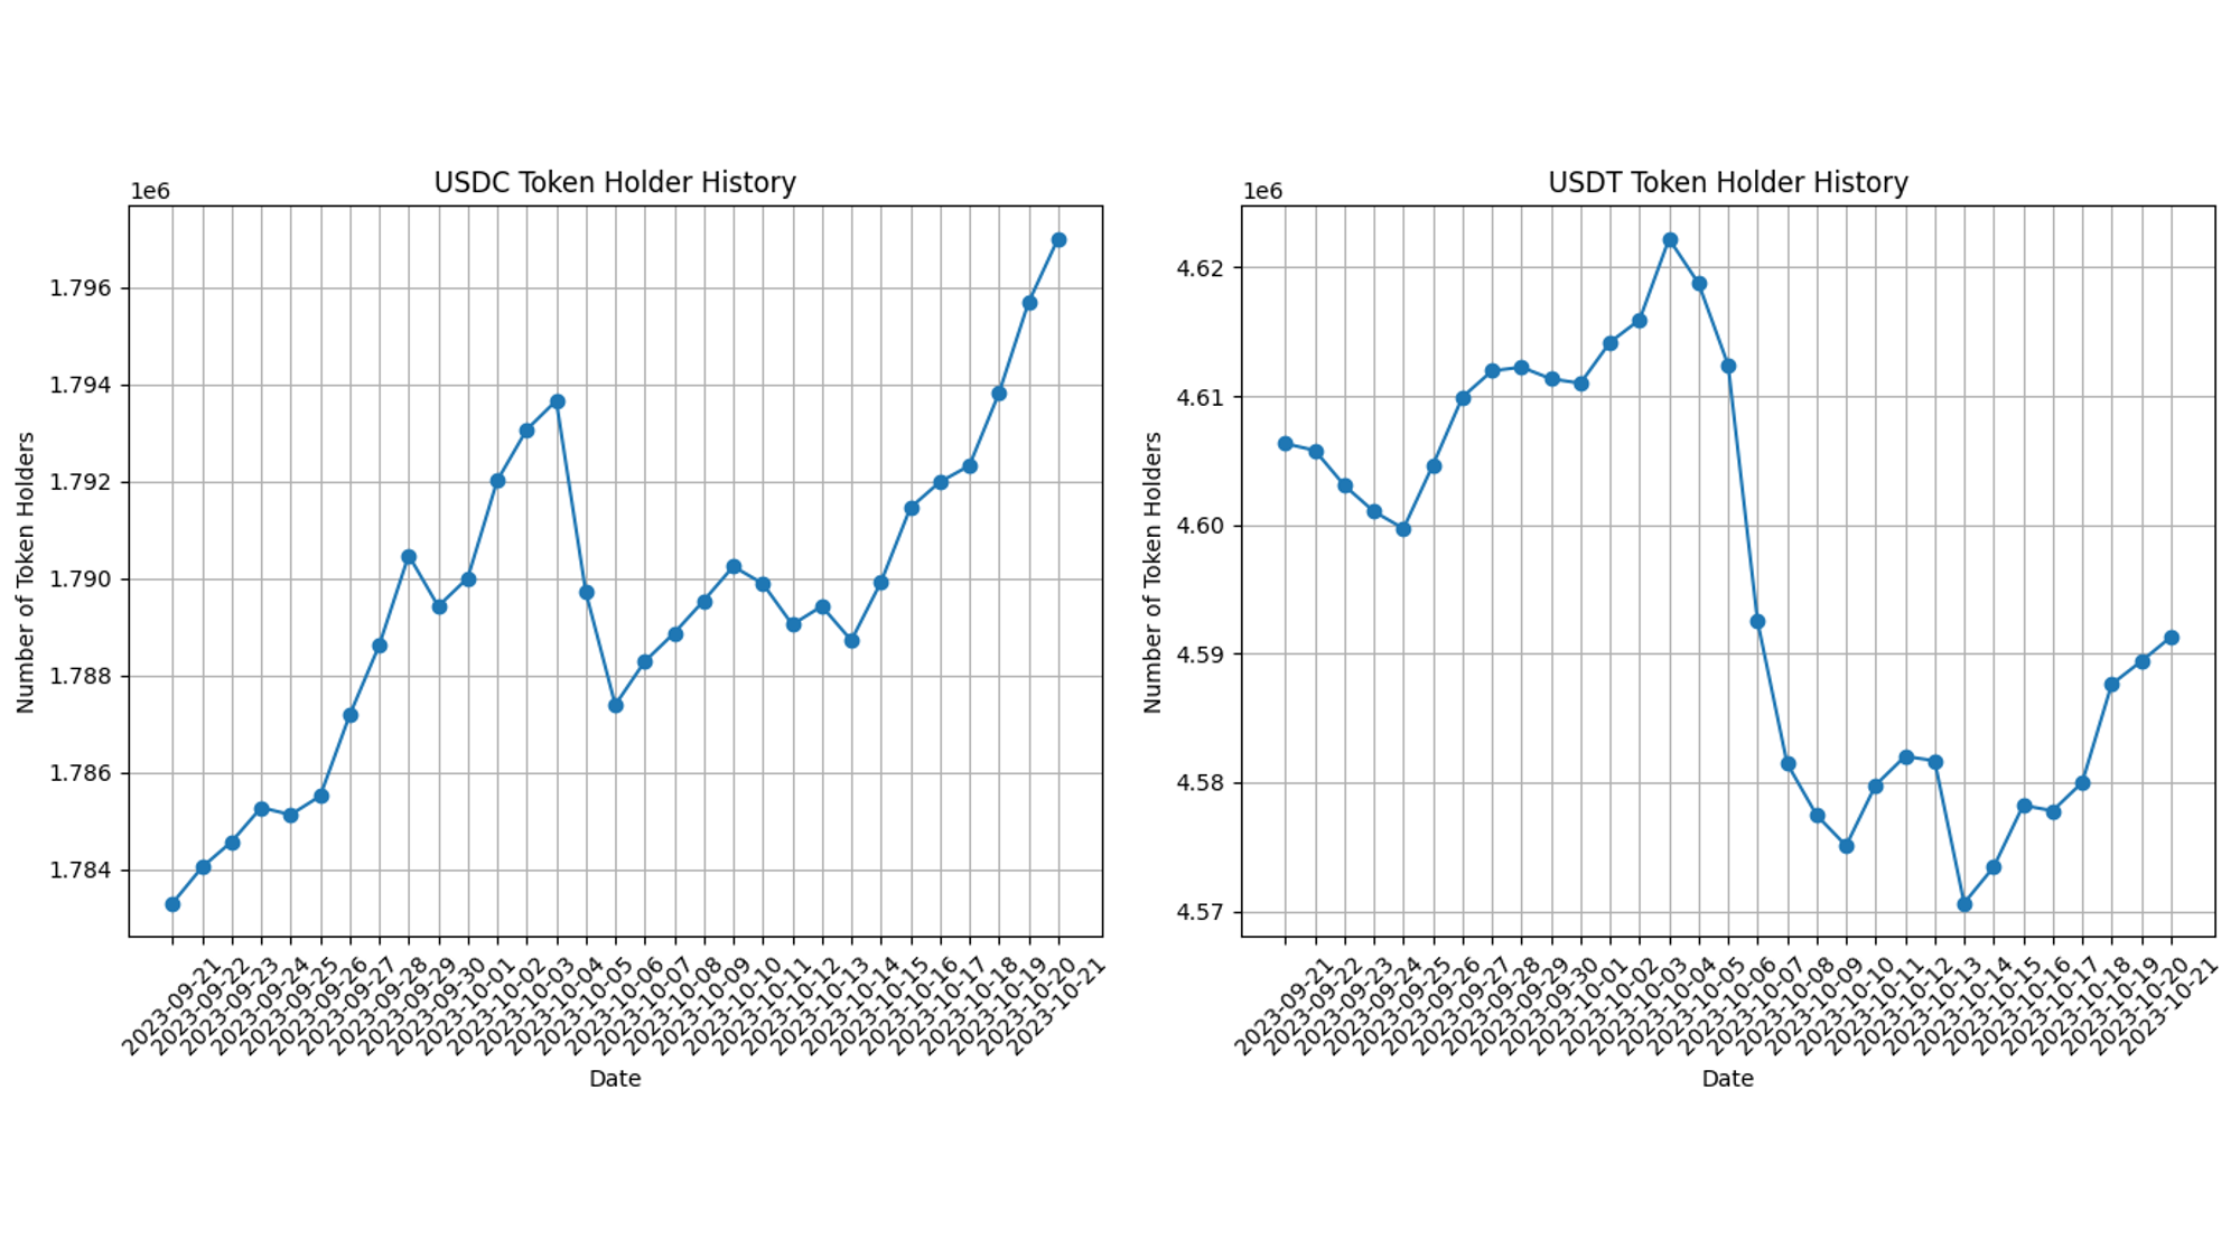
As we can see, the USDC is on a constant rise, with more than 13k new holders in the last month. On the other hand, USDT has it’s ups and downs, with a peak number of token holders of 4.60 million, but they have lost 15k if we compare with the start of the month.
Also Read: Arbitrum Ecosystem: A Comprehensive Look Using the Bitquery API
How many people have dumped tokens over the last month?
In the above section, we only saw growth or reduction in the number of holders, but we don’t know exactly how many people dumped or became users of these tokens. Let’s see how many wallets have dumped both of these tokens over the last month.
To get this data, we can write a query that checks if the last date for a wallet is that day of the month and the balance is zero and counts the number of wallets. This will give us those who have completely emptied their wallets of these tokens.
{
  EVM(dataset: archive, network: eth) {
    TokenHolders(
      limit: {count: 100}
      tokenSmartContract: "0xdac17f958d2ee523a2206206994597c13d831ec7"
      date: "2023-10-23"
      where: {BalanceUpdate: {LastDate: {is: "2023-10-23"}, OutAmount: {gt: "0"}}, Balance: {Amount: {eq: "0"}}}
    ) {
      uniq(of: Holder_Address)
    }
  }
}
You can try this query in the IDE. Similar to the above section, we will iterate over the last month by changing the date. Let’s see what data it gives us.
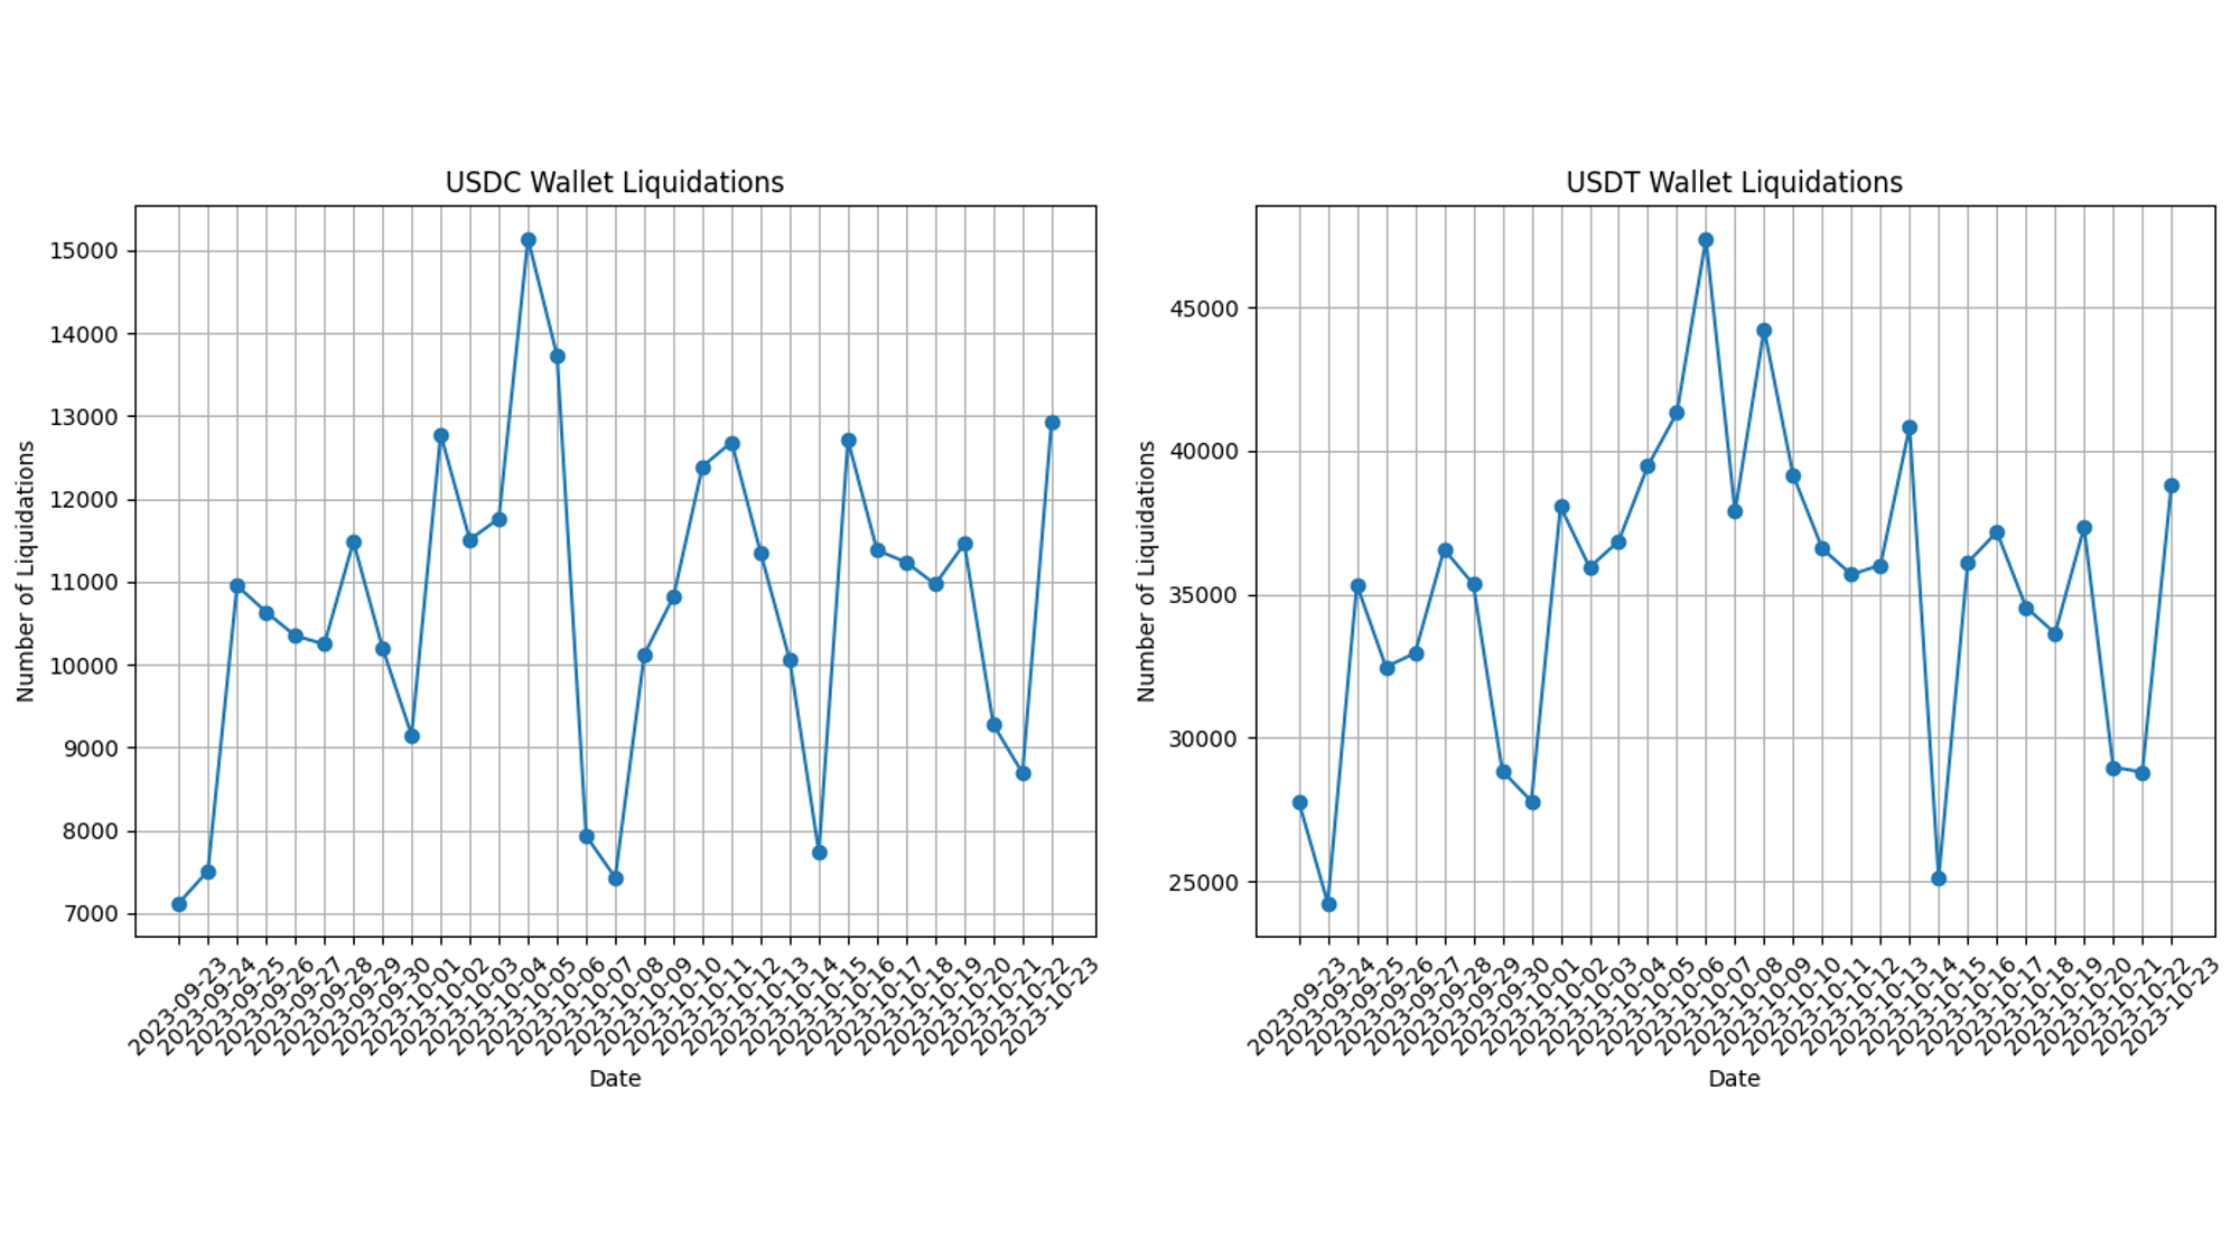
A lot of wallets liquidate on a daily basis for both of the tokens, USDC and USDT. Still, liquidations for USDT are twice as many, but a lot of wallets hold USDT, so that’s not surprising.
The lowest number of liquidations for USDT, which is around 24K, is still 9K more than the highest number of liquidations for USDC, which is 15.1K. There is no such pattern for liquidations for both of the tokens from last month.
Who are the top holders?
There are a lot of wallets, but who are the top holders? These big wallets are the ones who make big moves. If a small number of wallets hold a large amount of supply, then these wallets have the ability to manipulate token value or do something nefarious.
Note that both of the tokens we are using for the comparison here are very reputed tokens, so we don’t need to worry about big wallets doing something like that. The statement above is just a general statement for any token.
Let’s write a query to get the top token holders. To get top holders by balance, we need to get all the holders and order them in descending order of their balances. To do that, we can use the orderBy filter, use descending, and set it’s value to Balance_Amount. Lastly, use limit to get only the first 10.
{
  EVM(dataset: archive, network: eth) {
    TokenHolders(
      date: "2023-10-23"
      tokenSmartContract: "0xA0b86991c6218b36c1d19D4a2e9Eb0cE3606eB48"
      limit: {count: 10}
      orderBy: {descending: Balance_Amount}
    ) {
      Balance {
        Amount
      }
      Holder {
        Address
      }
    }
  }
}
You can do this for both tokens by changing the value of tokenSmartAddress. Run this query in the IDE to see the result.
Here are the top holders of USDT and USDC:
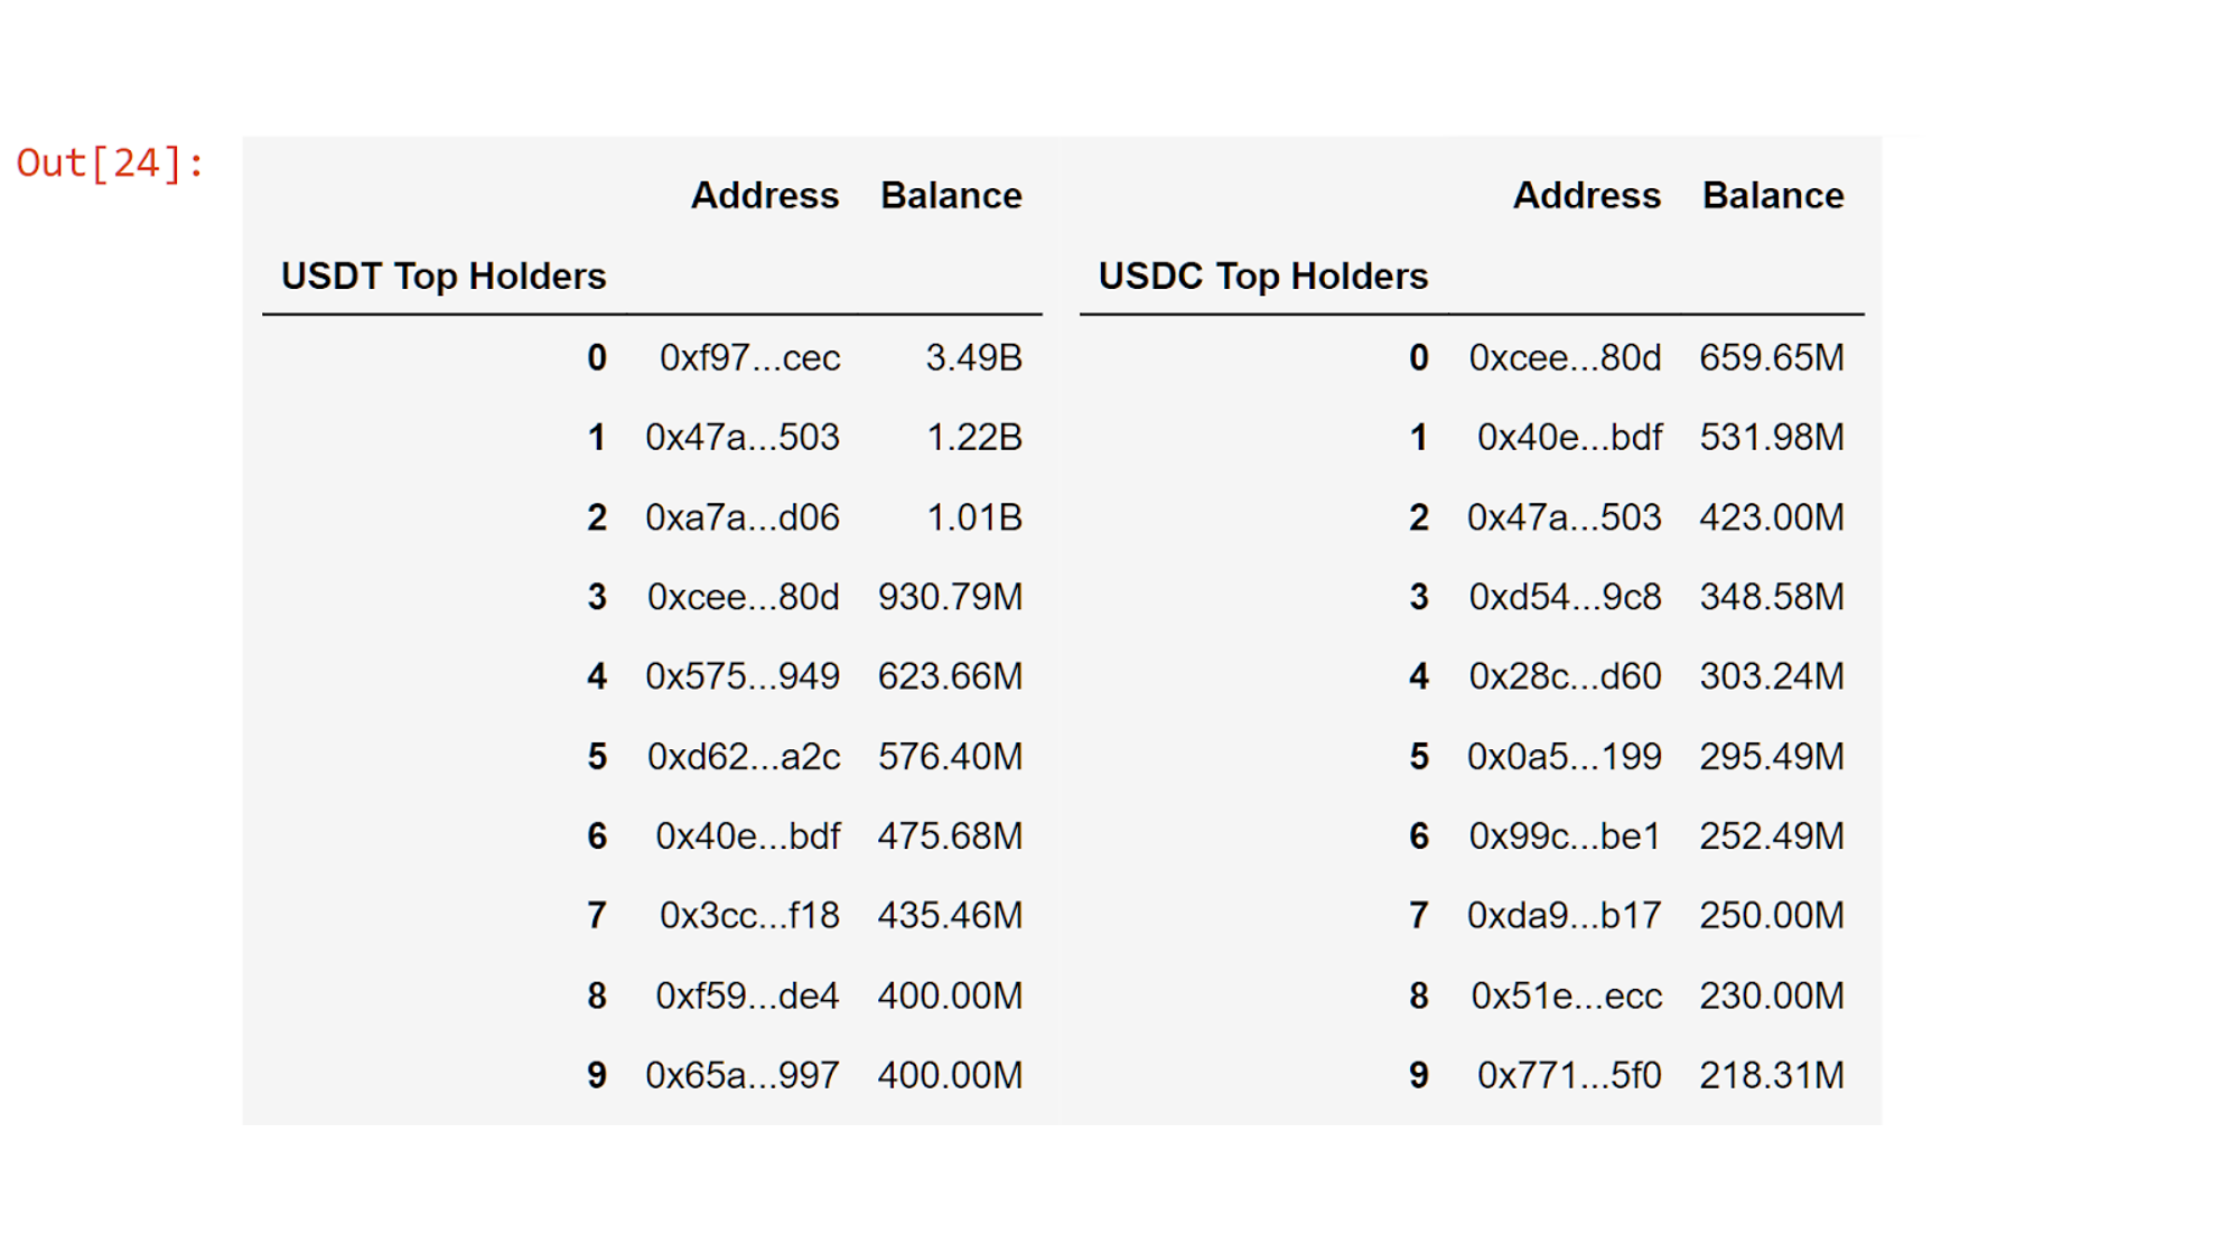
If we compare this with total supply, we can see that the top 10 holders of USDT hold 24.05% of the total supply, which is $39 billion, and the top 10 holders of USDC token hold 12.17% of the total supply, which is $23 billion.
We can see how there is inequality in the token distribution. We will talk about inequality among the token holders in a later section, so hang tight. We will go in-depth on it and try to find some interesting insights.
Where are the whales?
If you’re new to crypto, then you might not know what whale means, but in general, whale means holders who hold a large number of tokens. The definition of whale is very subjective to each token, and different people will also have different definitions for who the whales are in that token community.
For our purposes, we will consider wallets over $1 million in USDT or USDC tokens, whales. Let’s write a query to get the count of whales in each ecosystem.
In this query, we will get count with the uniq field, but to filter wallets that hold tokens worth more than $1 million, we need to add a filter for balance amount, which we can do by using the Amount field of Balance and setting the value to 1000000.
{
  EVM(dataset: archive, network: eth) {
    TokenHolders(
      date: "2023-10-23"
      tokenSmartContract: "0xA0b86991c6218b36c1d19D4a2e9Eb0cE3606eB48"
      where: {Balance: {Amount: {gt: "1000000"}}}
    ) {
      uniq(of: Holder_Address)
    }
  }
}
You can try this query in the IDE to see the result.
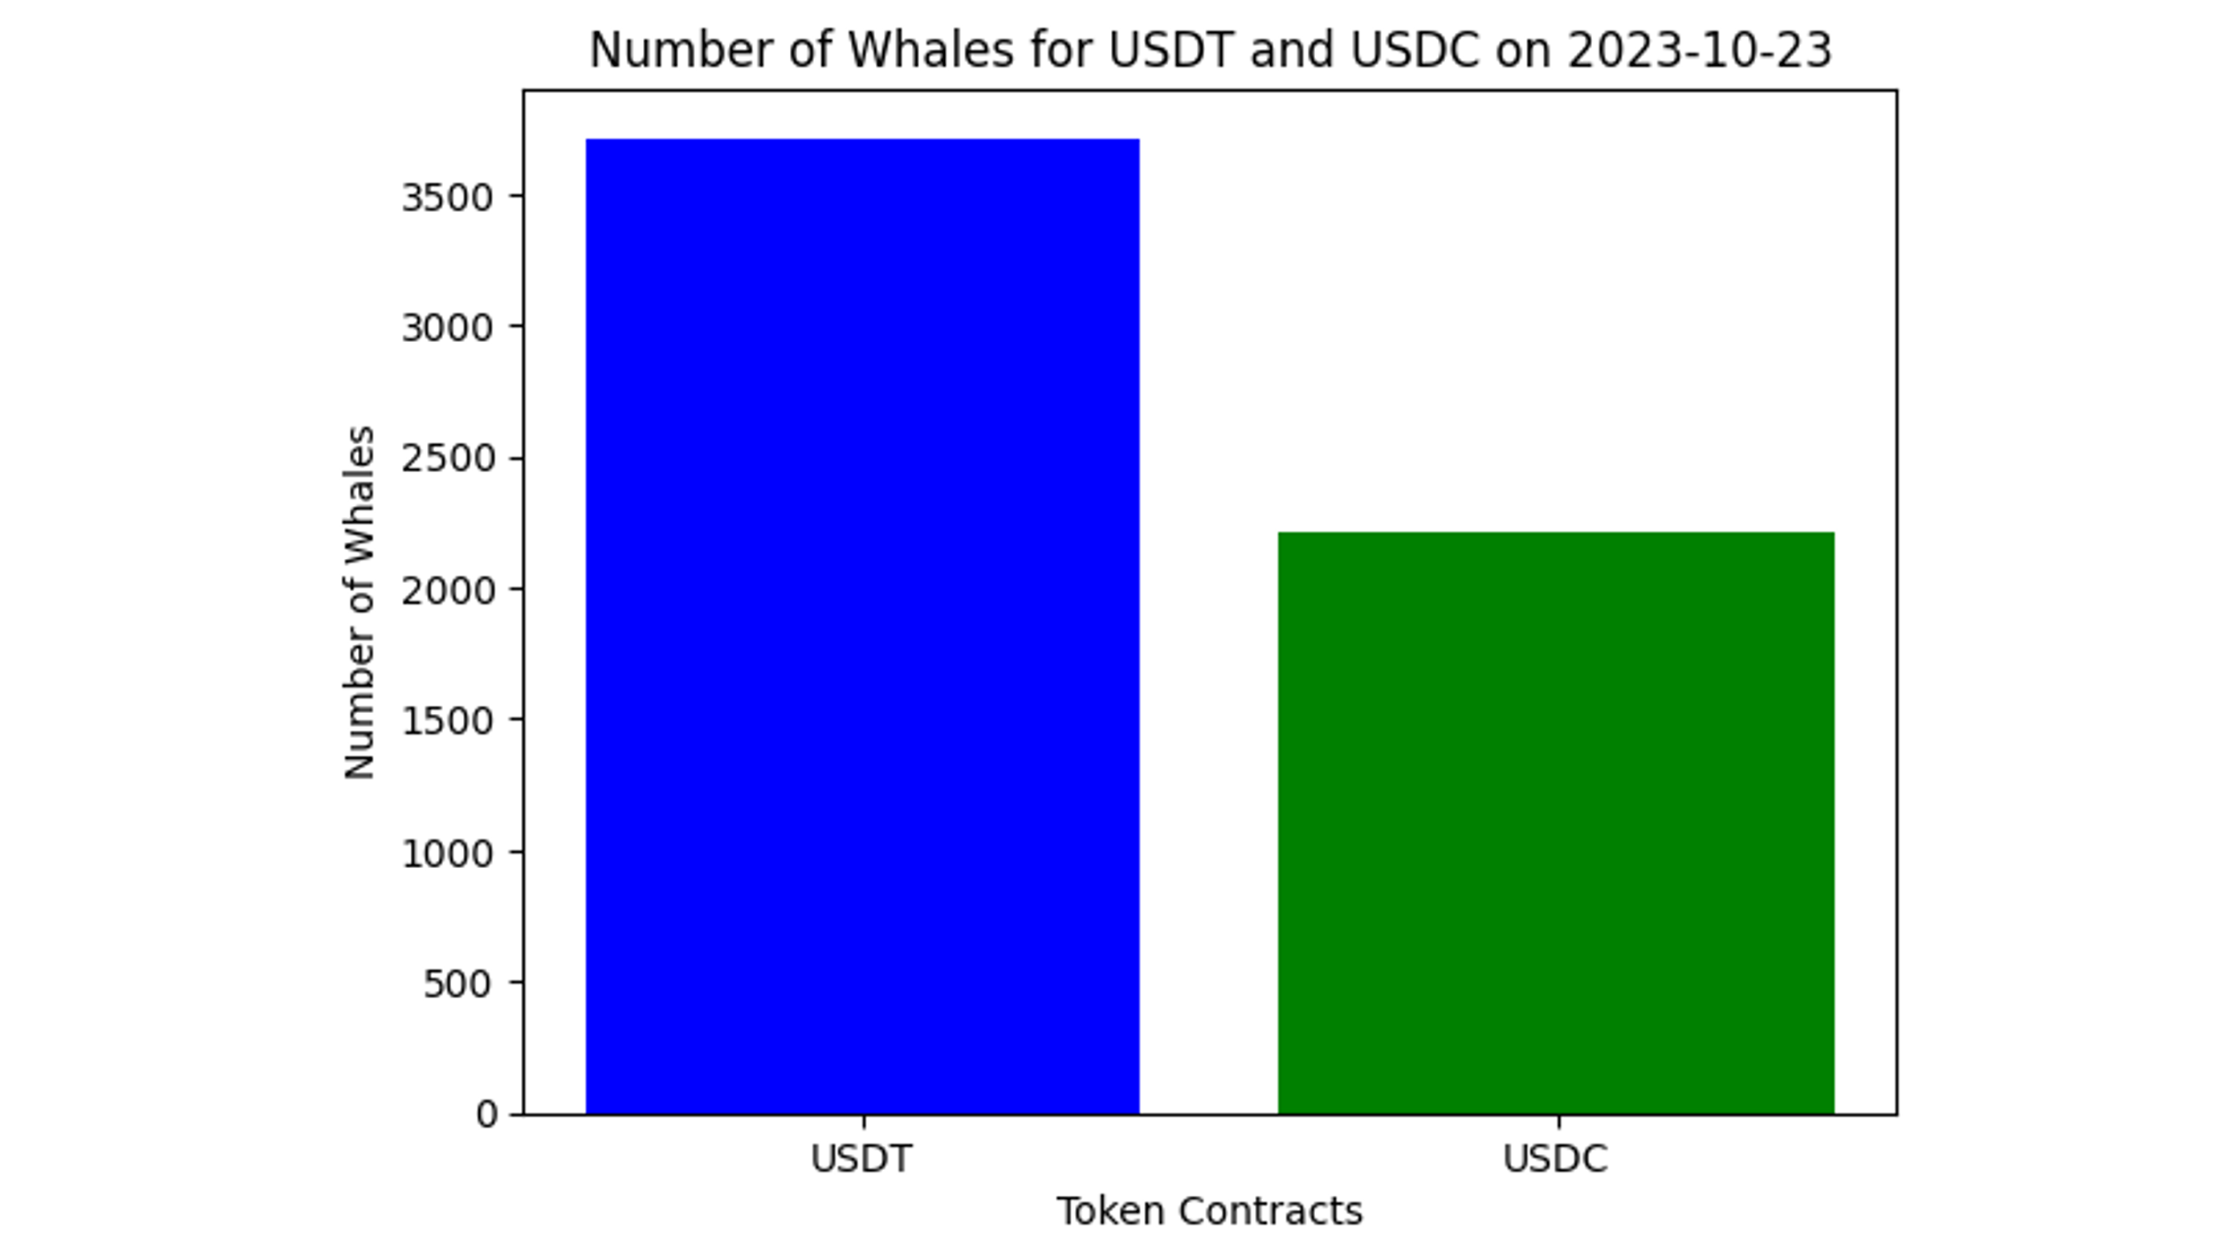
Here is the data we got, there are more than 3.7k whales using USDT compared to just around 2.2k for USDC. This again shows the dominance of USDT in the stablecoin ecosystem.
We have seen the number of whales for both tokens, but is there any change in that number over the last month?
To get that data, we are going to use the first query and set the Amount filter to 1000000. We also need to iterate over each day to get the data.
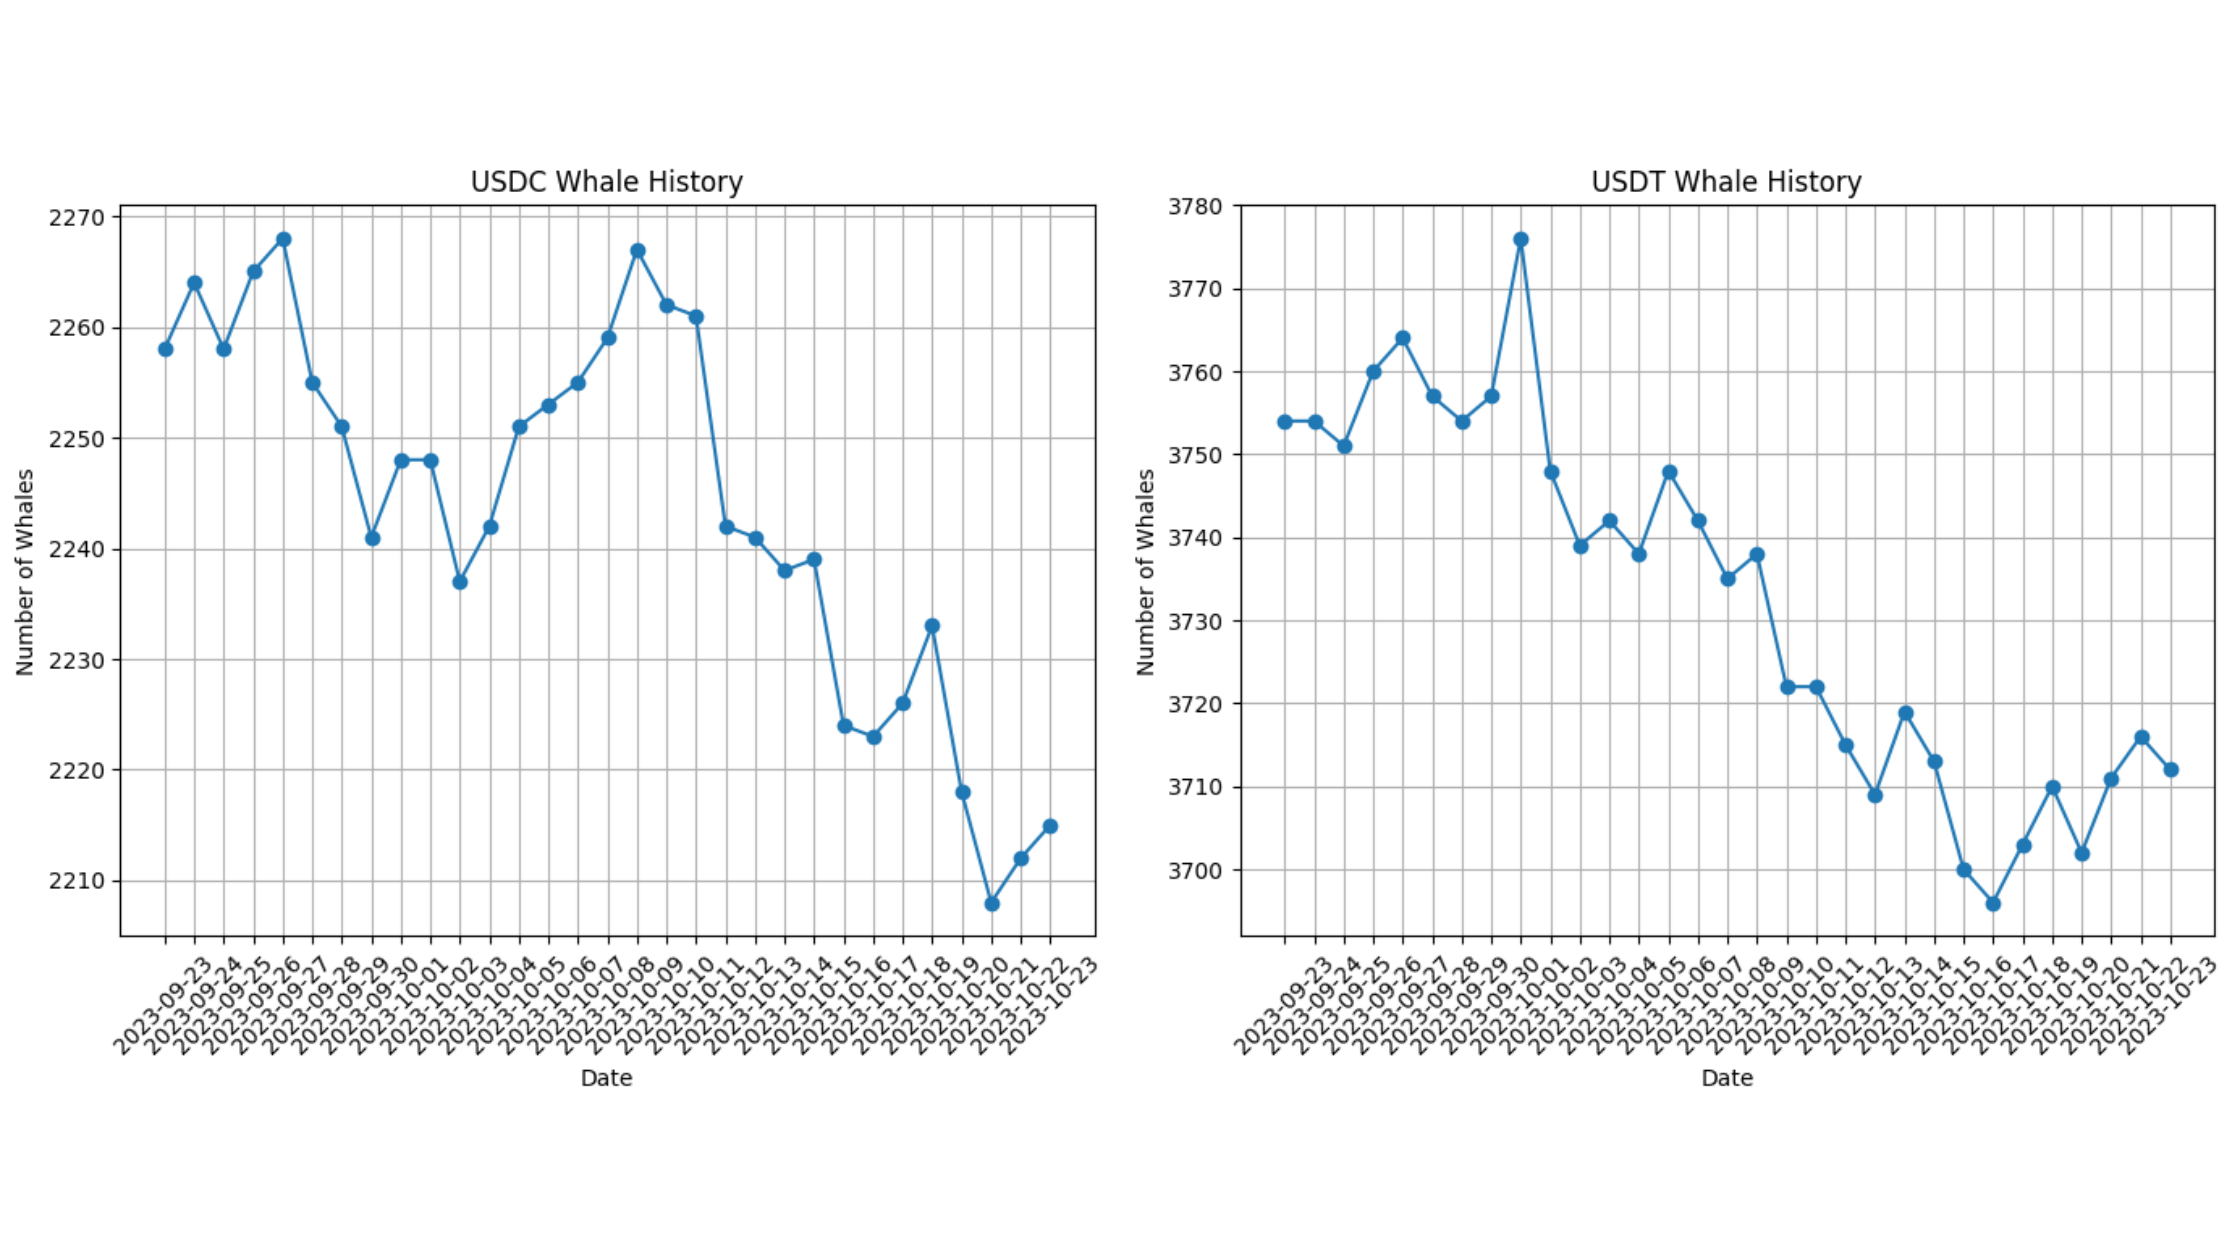
The number of whales is going down for both tokens over the last month. Is there a reason for this? Maybe you can explore this on your own with our API. What do you think? Here is something interesting you can use to explore money flow data in-depth.
What is the most used token?
Let's take a look at our last question, which is what token is used the most. How many people are actually doing transactions with each of these tokens?
To get the total out amount, we can use the sum field and get the total BalanceUpdate_OutAmount. This gives us the total outgoing amount for the entry span of the token.
{
  EVM(dataset: archive, network: eth) {
    TokenHolders(
      date: "2023-10-22"
      tokenSmartContract: "0xdAC17F958D2ee523a2206206994597C13D831ec7"
    ) {
      sum(of: BalanceUpdate_OutAmount)
    }
  }
}
You can try this query in the IDE to see the result.
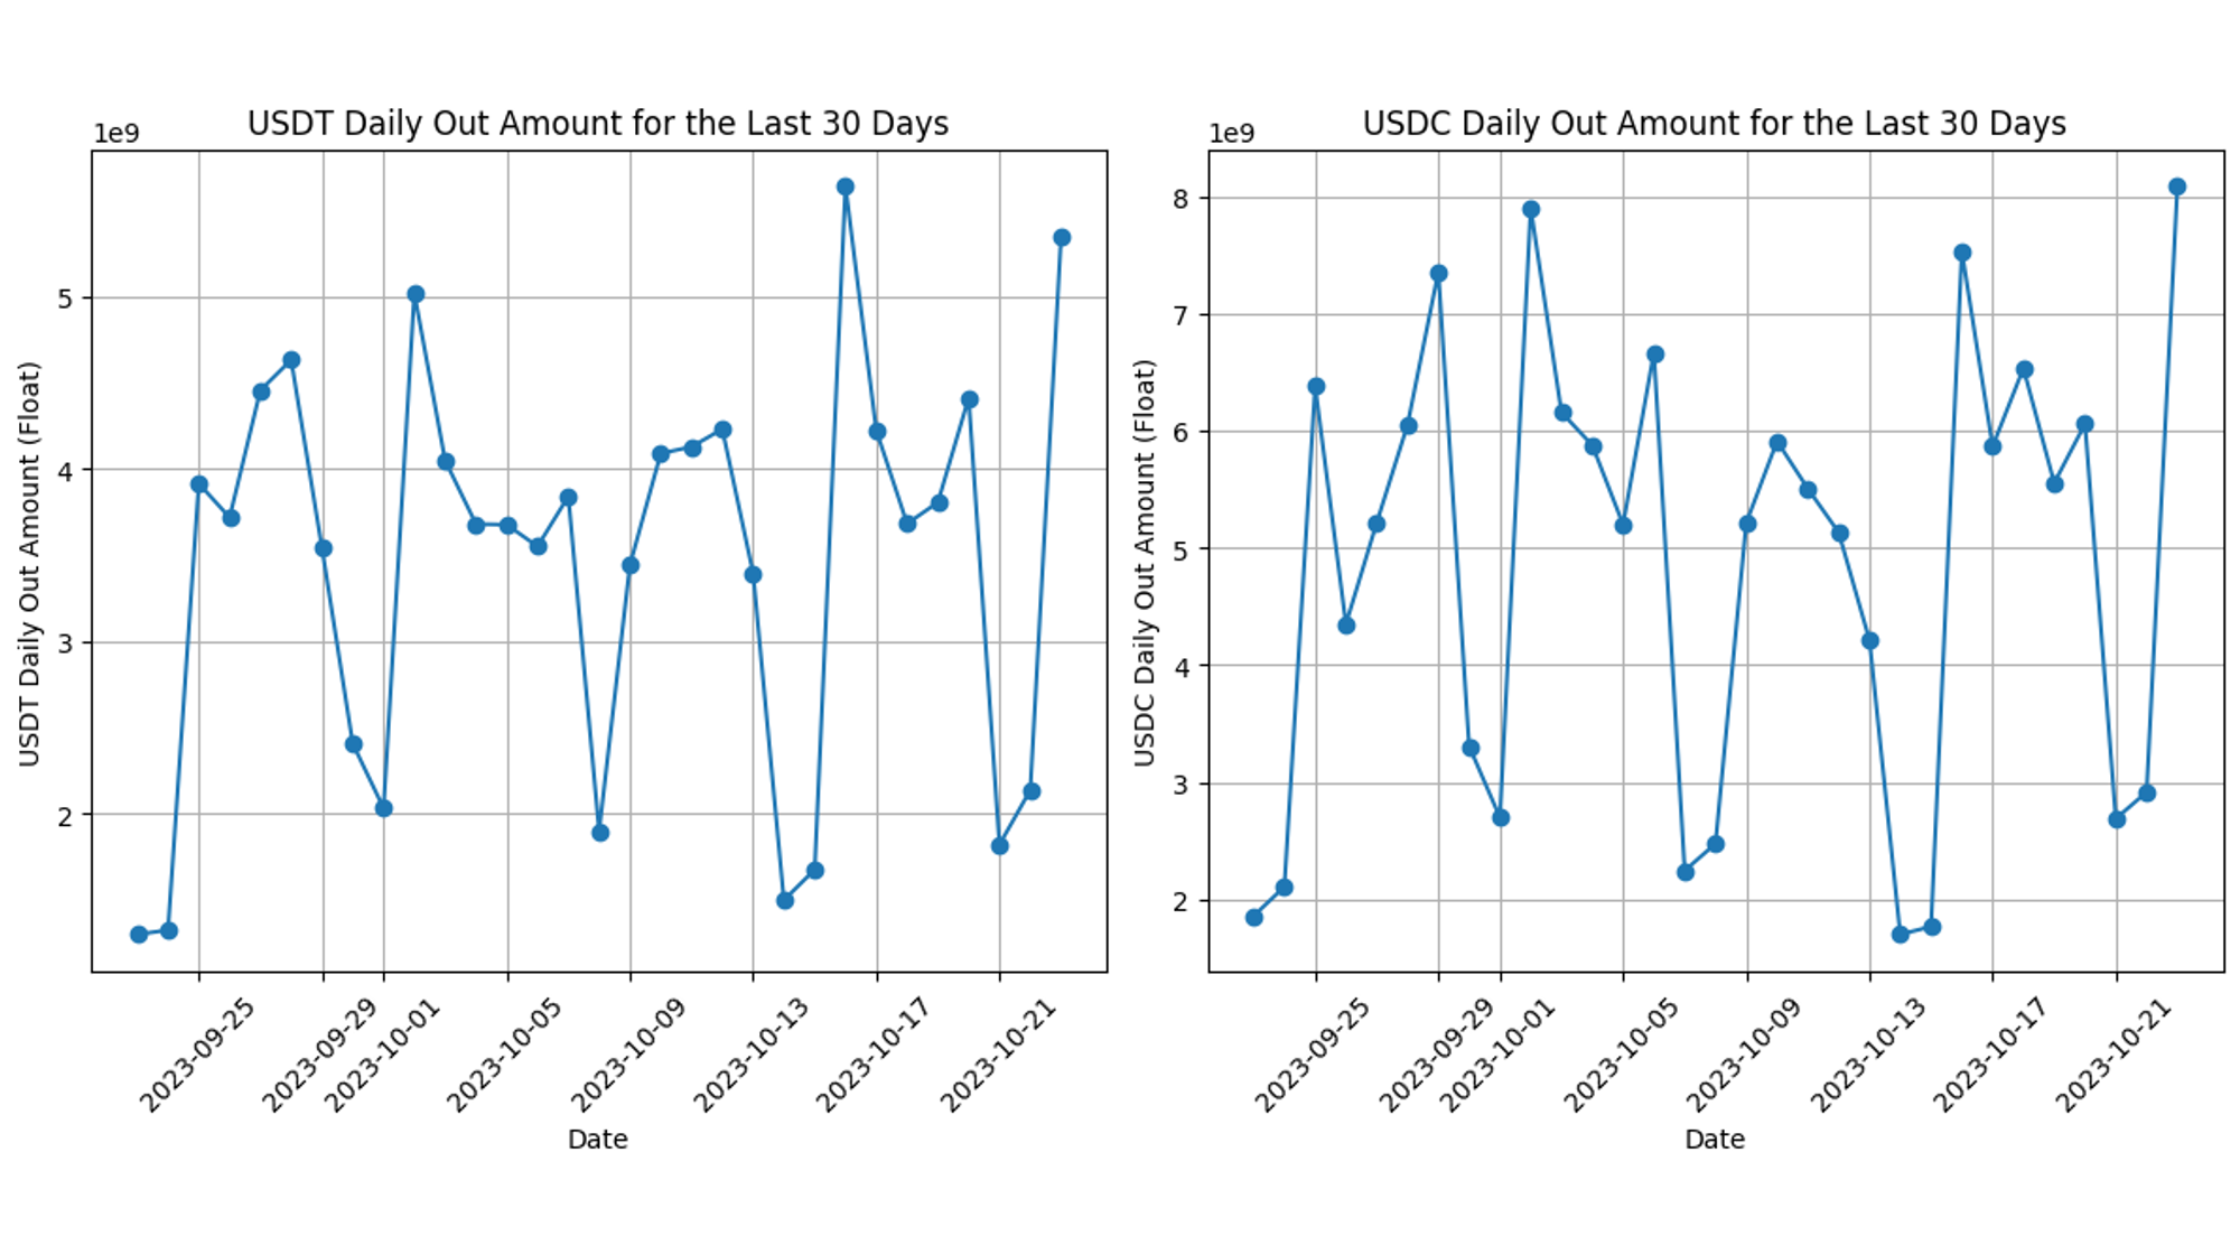
As you can see, there are a lot of users spending USDC compared to USDT. The daily spend of USDC over the last month has reached a peak of $8 billion spent in a day, which is ~$2.5 billion more than the amount spent with USDT at its daily peak over the last month.
Also Read: Top Ethereum Mempool Data Providers
Inequality in Token Distribution
Token distribution is most important part of the token economy after tokenomics. We can ignore the tokenomics factor for now; it can be a topic for decision in the future.
So why is token distribution the most important factor? If a small number of wallets hold a large number of tokens, they hold the power to manipulate the price of a token or do something nefarious.
To see the inequality in the distribution of tokens, we have different metrics like the Gini coefficient, the Nakamoto coefficient, and the Thiel index. All of these metrics give us the ability to calculate the inequality of distribution for a particular token.
Gini coefficient
The Gini coefficient gives us statistical dispersion in token distribution. Dispersion means how much distribution is stretched or squeezed. The Gini coefficient ranges from 0 to 1, where 0 shows complete equality and 1 shows complete inequality.
Let’s write a query to get the Gini coefficient for both tokens. To get the Gini coefficient, we can just select the gini field and set the value to Balance_Amount.
{
  EVM(dataset: archive, network: eth) {
    TokenHolders(
      date: "2023-10-23"
      tokenSmartContract: "0xA0b86991c6218b36c1d19D4a2e9Eb0cE3606eB48"
      where: {Balance: {Amount: {gt: "0"}}}
    ) {
      gini(of: Balance_Amount)
    }
  }
}
You can try this query in the IDE and see the results.
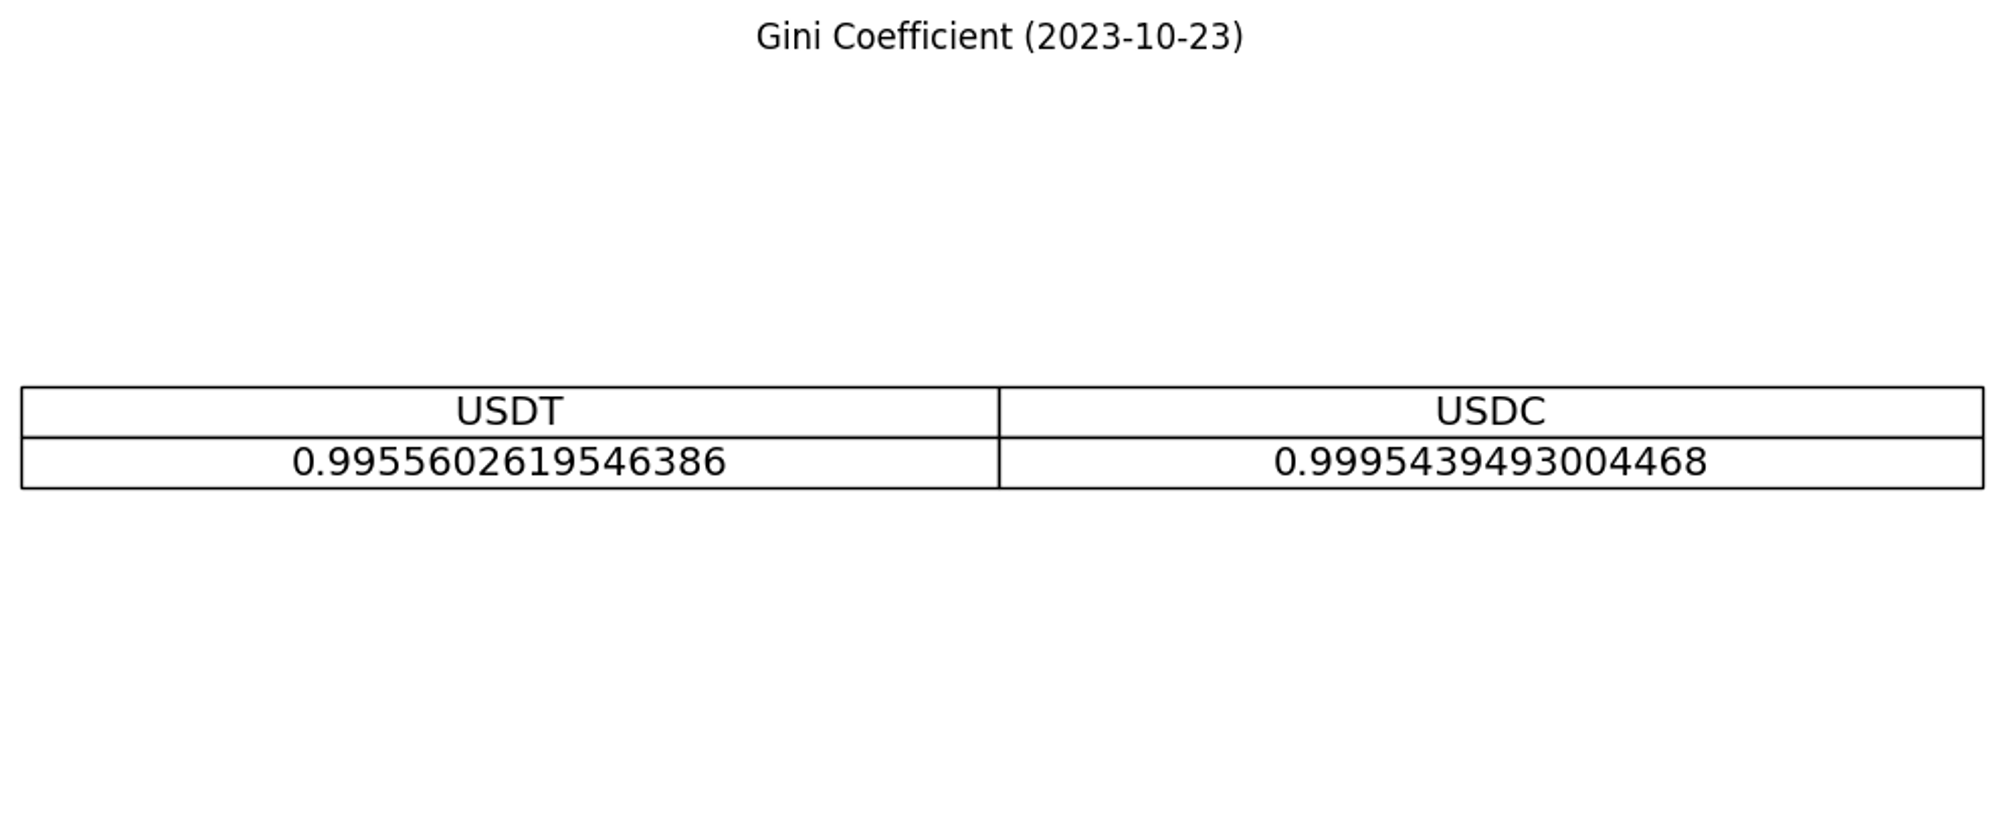
For the result, we can see that the Gini index for both shows very high inequality in the distribution.
This comes with a caveat. Do you know what that is?
We are getting data here for all the addresses here that involve smart contracts for projects like Uniswap or Aave and centralized exchanges like Binance and Coinbase. These wallets hold user tokens, but when calculating the Gini index, we can’t separate the amount of each holder from these wallets. This gives us a Gini index for token distribution with actual on-chain data, but that is not the reality for token distribution.
Even though there are discrepancies in the calculation, that is not to say there is no inequality because the calculation is skewed. There is still inequality in the distribution of tokens among individual token holders, where a small number of people control a very large number of tokens.
Nakamoto Coefficient
The Nakamoto coefficient tells how decentralized any blockchain network is. In other words, it tells us how many people can do a 51% attack on the network.
In terms of tokens, the Nakamoto coefficient tells us how many people hold 51% of the token supply. Let’s write a query to get the Nakamoto coefficient for both tokens.
We just have to select the nakamoto field and set the value to Balance_Amount. Also, set the ratio to 0.99.
{
  EVM(dataset: archive, network: eth) {
    TokenHolders(
      date: "2023-10-23"
      tokenSmartContract: "0xdAC17F958D2ee523a2206206994597C13D831ec7"
      where: {Balance: {Amount: {gt: "0"}}}
    ) {
      nakamoto(of: Balance_Amount, ratio: 0.99)
    }
  }
}
You can run this query in the IDE to see the results for any date you want.
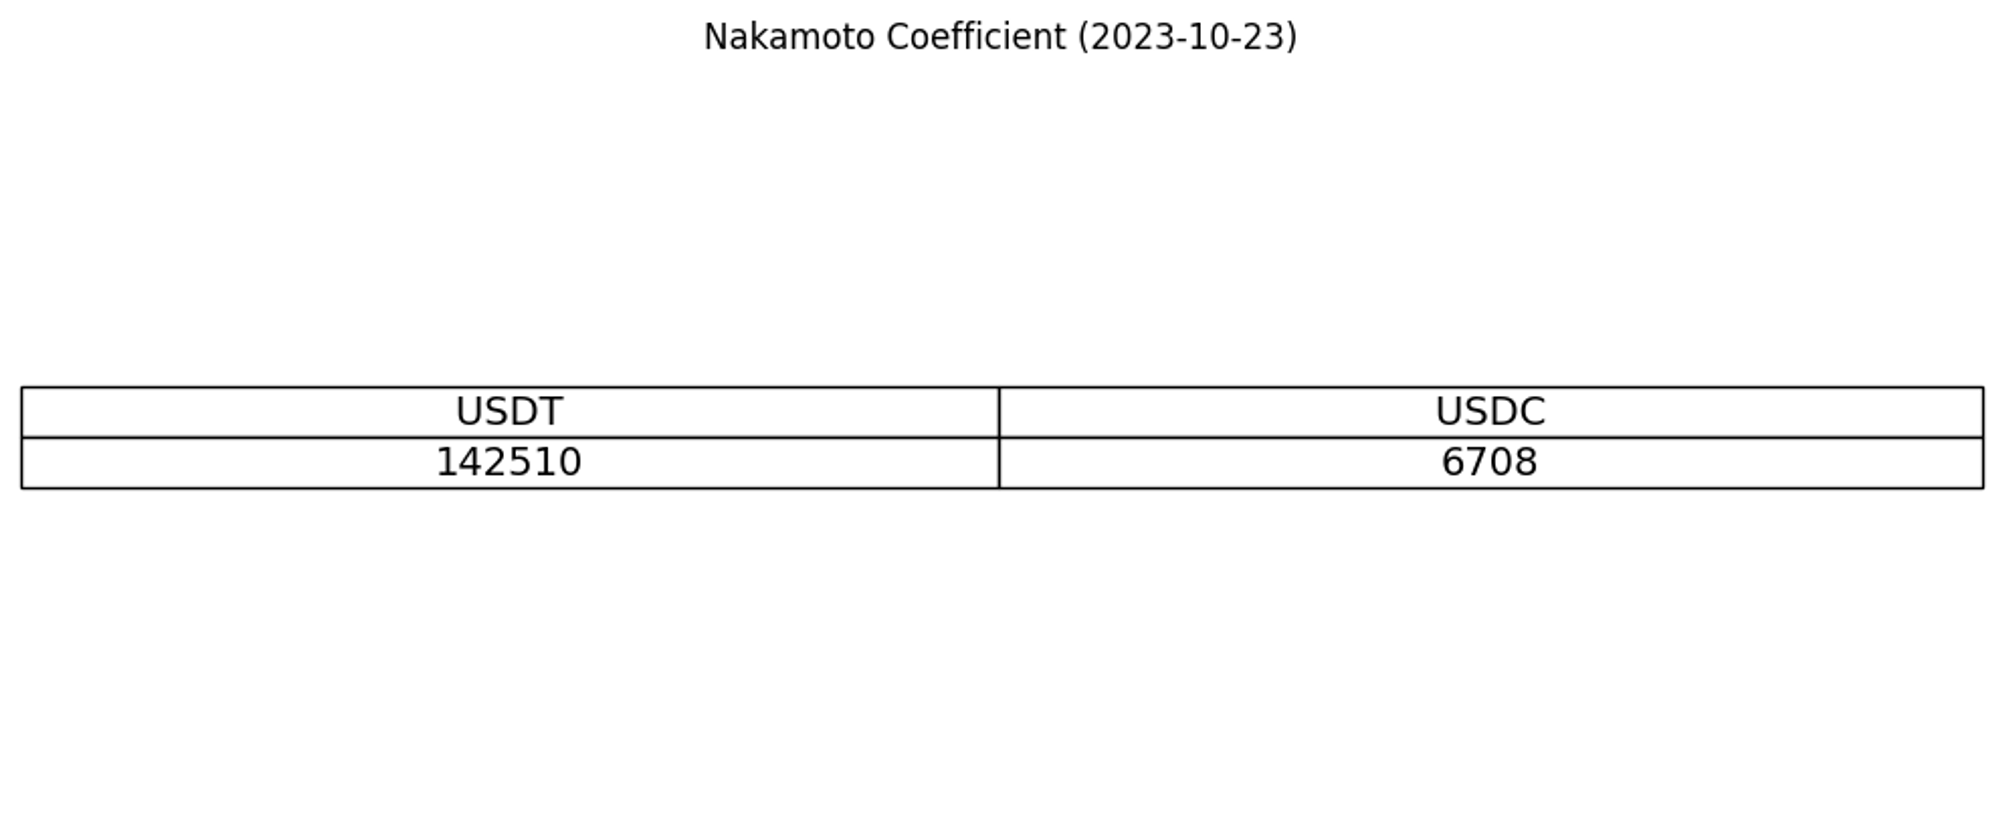
As you can see in both USDC and USDT, a very small number of wallet holders account for more than 51% of the supply. We have seen the data, and the result is clear about which token is more decentralized.
Conclusion
The aim of this article was to showcase the usecases for Bitquery’s new Token Holders API. I think we have seen more than enough, but more important than that was learning what kind of questions blockchain data can answer when doing research. We have learned how to ask the right questions and query data from the blockchain to answer those questions.
Let’s talk about USDC vs. USDT. None of these tokens is better than others. USDT has been in the arena much longer than USDC, so there are a lot more people using USDT. Interesting thing we found is that activity is much more on USDC in terms of more wallets using it and also the amount spent on a daily basis using USDC.
We have the one token that has ruled the sector for so long and a new rival that is trying to compete with it. Not exactly David and Goliath, but still an interesting competition to keep an eye on.
About Bitquery
Bitquery is your comprehensive toolkit designed with developers in mind, simplifying blockchain data access. Our products offer practical advantages and flexibility.
-
APIs - Explore API: Easily retrieve precise real-time and historical data for over 40 blockchains using GraphQL. Seamlessly integrate blockchain data into your applications, making data-driven decisions effortless.
-
Coinpath® - Try Coinpath: Streamline compliance and crypto investigations by tracing money movements across 40+ blockchains. Gain insights for efficient decision-making.
-
Data in Cloud - Try Demo Bucket: Access indexed blockchain data cost-effectively and at scale for your data pipeline. We currently support Ethereum, BSC, Solana, with more blockchains on the horizon, simplifying your data access.
-
Explorer - Try Explorer: Discover an intuitive platform for exploring data from 40+ blockchains. Visualize data, generate queries, and integrate effortlessly into your applications.
Bitquery empowers developers with straightforward blockchain data tools. If you have questions or need assistance, connect with us on our Telegram channel. Stay updated on the latest in cryptocurrency by subscribing to our newsletter below.
Subscribe to our newsletter
Subscribe and never miss any updates related to our APIs, new developments & latest news etc. Our newsletter is sent once a week on Monday.


