Understanding Wealth Distribution with Gini and Nakamoto Coefficients
As the title suggests, we are going to talk about wealth distribution in the token economy of a particular token. What does this actually mean?
Wealth distribution is just how wealth is distributed in a given society or country. In the context of tokens, wealth distribution will be how tokens are distributed amongst token holders.
But why are we talking about token/wealth distribution? Because if a small number of people hold a large amount of tokens, then that small group of people can abuse their power for their profits. The thing to note here is that not everyone with a huge amount of tokens doesn't abuse the power, but knowing the distribution of tokens will help us understand many other things.
Measuring Inequality
To understand wealth distribution, we need to use various metrics that will allow us to quantify the extent of inequality. The two most common metrics are the Gini Coefficient and Nakamoto Coefficient.
Gini Coefficient
Gini coefficient (aka Gini ratio or Gini index) is a common statistical tool that is used by many for understanding distribution of wealth or income in a given population. That population can be a country or city or in our context a token economy.
The Gini index gives us a way to quantify the equality or inequality in the wealth distribution. This helps people trying to understand that population.
Gini Coefficient of a token economy
Within the frame of a token economy, the Gini coefficient serves as a quantitative measure, providing insights into the distribution of wealth---specifically, tokens---among the holders.
Implications of Gini Coefficient
The Gini coefficient tells us important things about how tokens are spread out in a group. If the Gini number is low, it means more people have a fair amount of tokens. But if it's high, it shows that only a few people have most of the tokens.
Nakamoto Coefficient
We know that blockchains like Bitcoin and Ethereum are decentralized and no one entity controls it but what about if different entities in the network collaborate with each other to compromise the network? How many entities can control the network if they decide to do it?
We can understand that with the Nakamoto coefficient.
The Nakamoto coefficient is a quantitative measure that assesses decentralization of a blockchain network. It calculates the minimum number of nodes/validators required to compromise the network or do a 51% attack on the network. This numeric measure gives us the idea of decentralization of the system.
Balaji Srinivasan and Leland Lee proposed the Nakamoto coefficient to address the problem of quantifying an important aspect of blockchain network that is decentralization. You can read the original post of the Nakamoto coefficient to understand it better.
Nakamoto coefficient's role in the token economy
Nakamoto coefficient gives us an idea about decentralization of blockchain networks but how does this relate to token economy?
In the token economy, we are going to use the Nakamoto coefficient to check how many addresses hold more than 51% of the supply of that token.
Implications of Nakamoto Coefficient
The Nakamoto coefficient gives us an absolute measure, which is the minimum number of entities that can compromise the network, unlike the Gini coefficient which gives us relative measure.
A high Nakamoto coefficient signifies that a large number of addresses holds 51% of the token supply. Conversely, lower Nakamoto coefficient means that a smaller number of addresses has significant token supply.
Also read: USDC vs USDT: Analyzing On-Chain Activities with the Token Holders API
Token's Gini and Nakamoto Coefficients
With Bitquery's Token Holders API, you can get all the coefficients we learned about earlier. You don't have to do all calculations, just get values directly from the API. Let's see how to fetch those by writing a graphQL query in the Bitquery IDE.
In the Token Holders query, we need to define the smart contract address and date on which you need the coefficient.
{
  EVM(dataset: archive, network: eth) {
    TokenHolders(
      date: "2023-11-05"
      tokenSmartContract: "0xdac17f958d2ee523a2206206994597c13d831ec7"
      where: {Balance: {Amount: {gt: "0"}}}
    ) {
      gini(of: Balance_Amount)
      nakamoto(of: Balance_Amount, ratio: 0.99)
    }
  }
}
You can run this query in IDE and see the results.
Wealth Distribution Analysis
Now that we have learned what both of these coefficients are and seen how to get those, let's analyze the top tokens from the Ethereum network.
We will loop over all these tokens with a Python script and see both coefficients for each of those tokens.
Here is the list of tokens and their Gini & Nakamoto Coefficient.
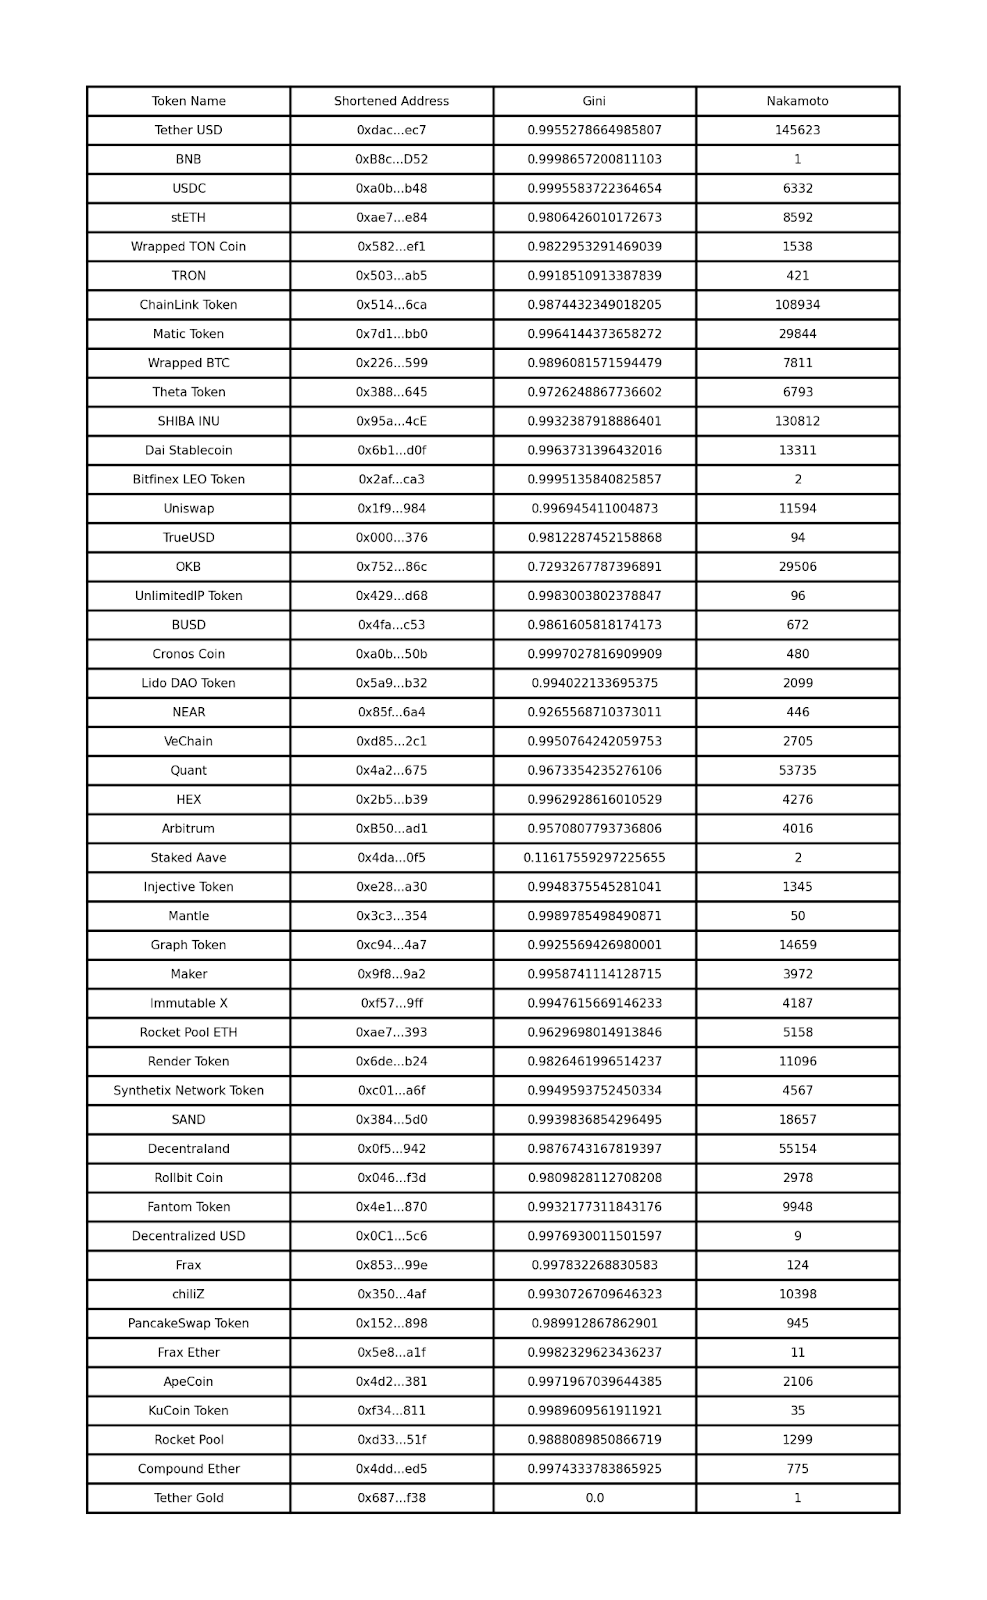
As we can see, most of the tokens have Gini coefficients of 0.9 and above with Nakamoto coefficients ranging from 1 to a few thousands.
What does this mean? For many of the tokens in the list, supply of them is held by a small number of addresses.
Understanding Governance with Gini and Nakamoto Coefficient
We talked about use cases and working of Gini and Nakamoto coefficients to understand token distribution among the holders but there can be niche use cases of both of the coefficients too. One of those use cases is understanding Governance for a project.
Most of the projects in the crypto ecosystem use governance tokens to govern the project and understand the opinion of project stakeholders.
Here we will take a look at LDO token which is the governance token for Lido DAO that manages liquid staking protocol, Lido. With Gini and Nakamoto coefficients for LDO token, we can get an overview of concentration of the governance within token holders.
You can run same query can above and change the tokenSmartContract to 0x5A98FcBEA516Cf06857215779Fd812CA3beF1B32 (LDO token address on Ethereum network). You can run this query in the IDE.
{
  EVM(dataset: archive, network: eth) {
    TokenHolders(
      date: "2023-11-12"
      tokenSmartContract: "0x5A98FcBEA516Cf06857215779Fd812CA3beF1B32"
      where: {Balance: {Amount: {gt: "0"}}}
    ) {
      Currency {
        Name
        SmartContract
      }
      gini(of: Balance_Amount)
      nakamoto(of: Balance_Amount, ratio: 0.99)
    }
  }
}
Let's see what the result are:
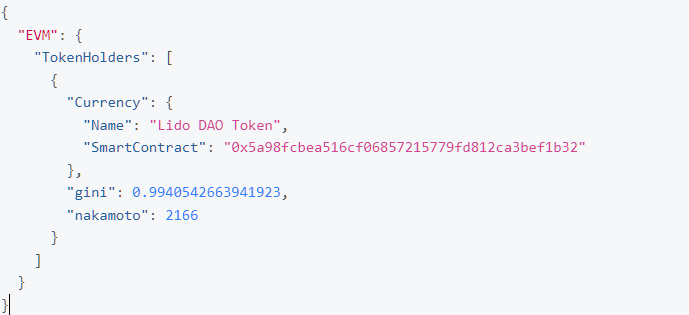
From the result, we can see that there is a high level of inequality in the distribution of the governance token and with Nakamoto we can see the same thing which is that 2166 holders out of 41.8k holders own the majority of the supply.
Change Governance Concentration Over Time
We can also see how the concentration of governance power has changed over time, this way we can have a better understanding of governance power within Lido DAO.
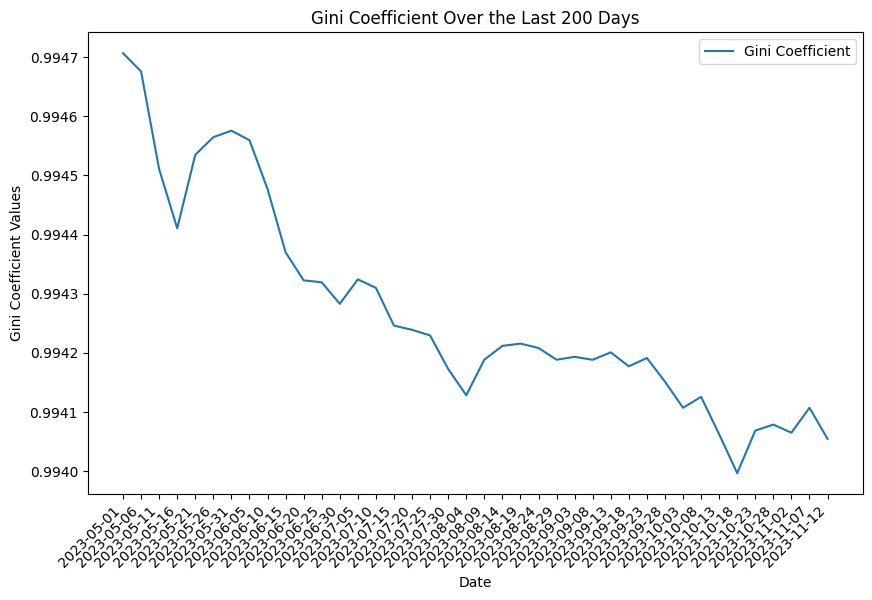
Here is the Gini coefficient of LDO token over the last 200 days. This graph shows us how the Gini coefficient is reduced over time which shows direction towards better distribution of tokens.
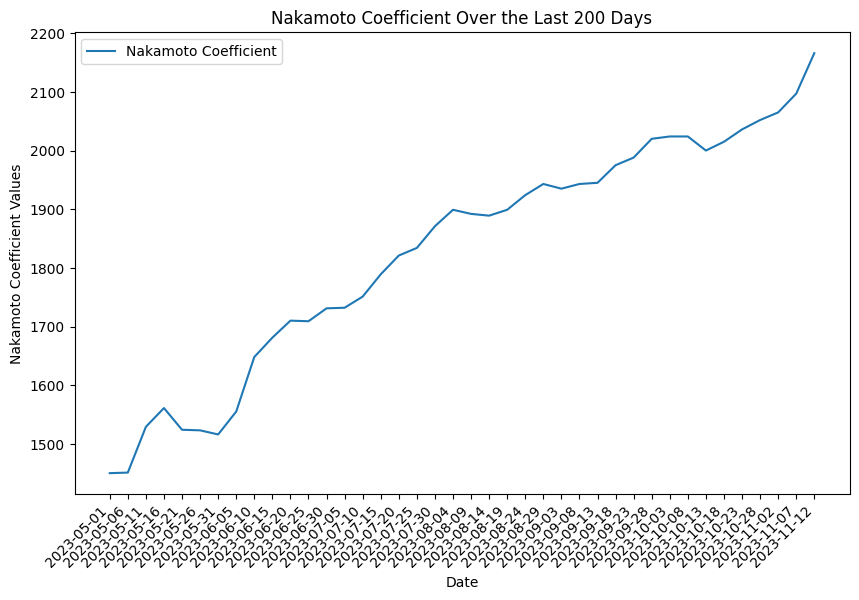
The below graph shows the change in Nakamoto coefficient over the last 200 days for LDO token. It shows a gradual increase over time, suggesting that a larger number of holders have the majority of the token supply.
One thing to note here is that when we are calculating the distribution of tokens. This does not mean distribution of governance power.
For many of the DAOs, people have the option to delegate their voting power to someone else and that other party can vote on behalf of people who have delegated power to them. That's why what we are seeing is distribution of LDO governance tokens and not the distribution of the governance power in the LIDO DAO.
Problem with Gini and Nakamoto Coefficients
There is a caveat in this calculation. Do you know what it is? When we take addresses into our calculations for Gini or Nakamoto Coefficient, we can't really separate smart contract addresses or centralized exchange addresses from addresses of individuals so these calculations show Gini index for all addresses and not individuals using those tokens.
Even this caveat is there knowing the distribution of the token is very important to understand the condition of the ecosystem.
Also read: Arbitrum Ecosystem: A Comprehensive Look Using the Bitquery API
Conclusion
In conclusion, our efforts to understand wealth distribution within a token ecosystem led us to understand two very useful and important metrics: Gini coefficient and Nakamoto coefficient. The Gini Coefficient provides a relative measure of wealth distribution, offering insights into how tokens are spread among holders. A low Gini number suggests a fair distribution, while a high one indicates concentration among a few.
On the other hand, the Nakamoto Coefficient serves as an absolute measure of decentralization within a blockchain network. Applied to the token economy, it helps assess the concentration of token supply among a specific number of addresses.
We also explored a niche use case of both coefficients which was to understand concentration of governance power within a DAO. For this article, we used an example of LDO token for Lido DAO. We also saw how concentration of governance power changed over time in Lido DAO.
These coefficients come with their limitations (which can be overcome) like exchange wallets considered as one entity but tokens that belong to users of that exchange. Despite these limitations, understanding token distribution remains an important factor for assessing the health and dynamics of the ecosystem.
About Bitquery
Bitquery is your comprehensive toolkit designed with developers in mind, simplifying blockchain data access. Our products offer practical advantages and flexibility.
-
APIs - Explore API: Easily retrieve precise real-time and historical data for over 40 blockchains using GraphQL. Seamlessly integrate blockchain data into your applications, making data-driven decisions effortless.
-
Coinpath® - Try Coinpath: Streamline compliance and crypto investigations by tracing money movements across 40+ blockchains. Gain insights for efficient decision-making.
-
Data in Cloud - Try Demo Bucket: Access indexed blockchain data cost-effectively and at scale for your data pipeline. We currently support Ethereum, BSC, Solana, with more blockchains on the horizon, simplifying your data access.
-
Explorer - Try Explorer: Discover an intuitive platform for exploring data from 40+ blockchains. Visualize data, generate queries, and integrate effortlessly into your applications.
Bitquery empowers developers with straightforward blockchain data tools. If you have questions or need assistance, connect with us on our Telegram channel. Stay updated on the latest in cryptocurrency by subscribing to our newsletter below.
Subscribe to our newsletter
Subscribe and never miss any updates related to our APIs, new developments & latest news etc. Our newsletter is sent once a week on Monday.


