Is wash trading a good way to get bots to trade your token? We found a better idea.
Token creators are told to wash-trade their token so bots and trending lists notice it. We pulled five days of Solana DEX trades through Bitquery MCP and tested it. Of 339 tokens that faked high volume with four or fewer wallets, exactly zero went on to attract a real crowd. The tokens that actually flip share a different fingerprint: seeded, parked at near-zero volume for days, then switched on, with hundreds of new wallets and millions in volume arriving in a single hour.
01 · The claim first
Wash trading does not get bots to trade your token. The data is one-sided.
If you launch tokens, trade new launches, or analyze them for a living, you have hit the same question: does faking volume actually work? Creators are told to wash-trade so bots and trending lists pick the token up. Traders see suspicious volume on a token with almost no holders and have to guess whether it is about to run or already dead. Analysts get handed the chart afterward and asked to explain it.
Every figure here came out of five days of Solana DEX trades, queried in plain English through Bitquery MCP. The short version, stated before the work: pure wash trading does not summon a crowd. Something else does, and it leaves a clear, repeatable signature you can screen for.
02 · What a flip hour looks like
Three flat days, then one vertical hour
Take the token trading under the symbol RTM. For about three days it was effectively dead. Plot new wallets per hour and the whole story is one picture: a flat line along the floor, then a single spike.
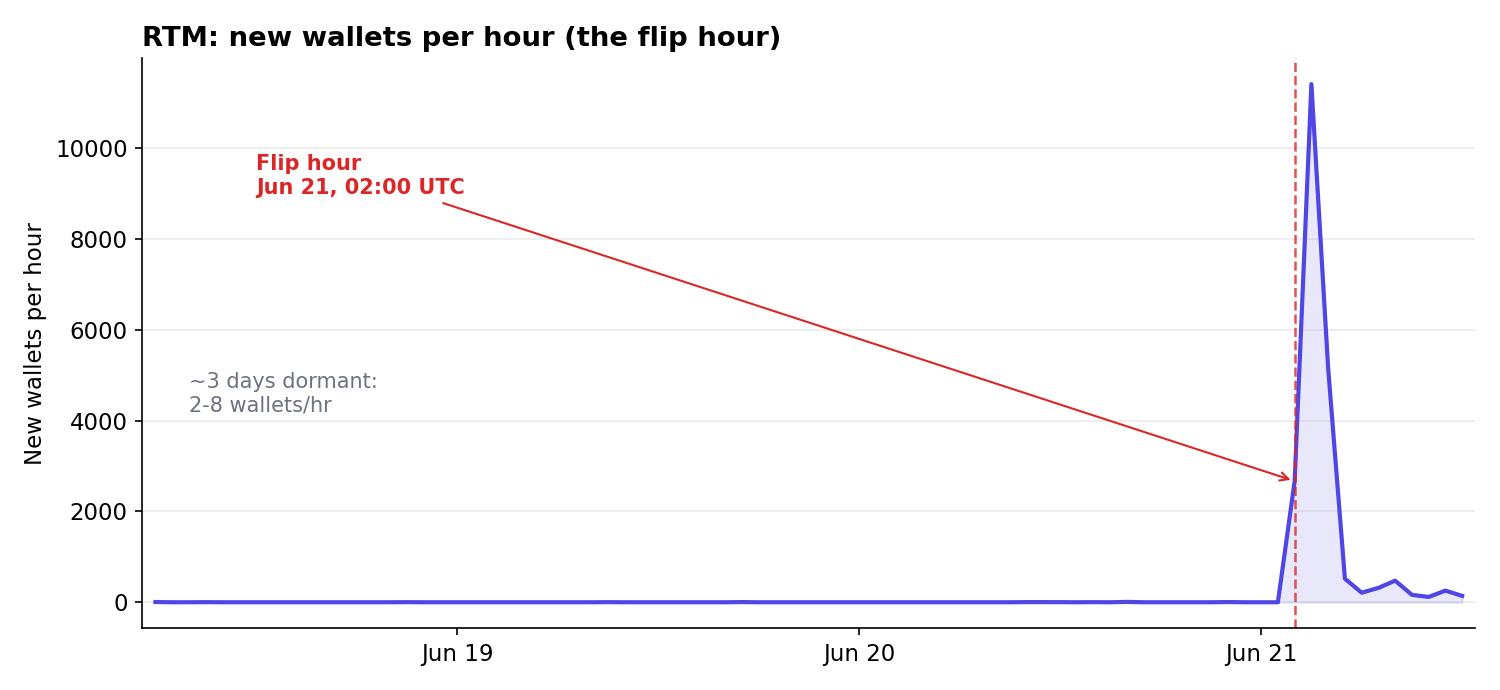
Nothing about the first three days predicts the fourth. The token was not building. No slow accumulation, no rising volume, no growing holder base. It went from two wallets and pocket change to 2,668 new wallets and $174K in one hour, then doubled again the next hour.
03 · The thing most people get wrong
Fake volume almost never brings a crowd
The intuitive story is that manipulators wash-trade a token to fake high volume, the fake volume earns a trending spot, and real traders pile in. Half of that is true. Wash trading is everywhere. The other half does not hold up.
We isolated every Solana token in the window that showed the classic wash signature: more than $20,000 in volume during its first three hours, generated by four or fewer wallets. That is a tiny number of addresses pushing real dollar volume back and forth.
There were 339 of them. The number that went on to attract more than 200 real traders was zero. Not a handful, not a few percent. We found single addresses running about a million dollars of buys and sells through one token, one wallet, 50 buys, 48 sells, $1.04M in "volume." The chart looks alive. The token is stone dead. Trending algorithms, and the bots that watch them, have largely learned to ignore volume that comes from one or two wallets.
04 · The real patternSeed, park, switch on
When we hunted for flip hours instead, meaning the first hour a token gains 200 or more brand-new wallets, and filtered to tokens that had only a handful of wallets beforehand, a much cleaner mechanism showed up.
This is the correction to the folk theory. The pre-flip phase is not a volume-pumping operation. It is a staging operation. The token is built, lightly seeded so it exists and has a price, and left dormant until some real trigger fires: a coordinated promotion, a paid trending placement, an influencer call, a listing. At that moment the crowd and the volume show up together, because they are both reacting to the same external signal rather than to anything that happened on-chain beforehand.
05 · It is a production line
The same template, deployed over and over
Two details make the staging read hard to avoid.
First, the symbols repeat. In a single five-day window we counted the symbol "SPCX" flipping across at least six different mint addresses, plus multiple "WorldCup" variants, multiple "ZERO," multiple "IRAN," multiple "PXM." These are not one token having a moment. They are the same template deployed over and over, each instance seeded and parked and flipped on its own.
Second, the timing clusters. A large share of the delayed flips sit in the 72 to 109 hour range from creation. Some of that is an artifact of a five-day window, since a token created right at the edge cannot show a flip older than the window. But the bunching is consistent with batches of tokens created together and activated on a schedule.
06 · Two flip timingsBundled launches versus parked tokens
The same data separates the two timings that matter. Instant flips, where the crowd arrives in the genesis hour, are bundled launches, with snipers buying in the same block the token is created. Delayed flips, dormant then tripping, are the seed-park-switch pattern above. Both manufacture the appearance of spontaneous demand. Only one of them does it slowly enough to watch.
07 · The external trigger
Promotion is real, but it trails the flip
On-chain data shows the activation, not its cause, so we went looking for the cause off-chain. Searching X for the contract address surfaces coordinated promotion on several of these tokens. RTM has a cluster of posts spamming its address, one of them stating it outright: "the developer said he'll pay for a x30 boost dex after 4 new members in coin community." SHIBU has its own promoter handle and a string of "paid partnership" replies posting the mint.
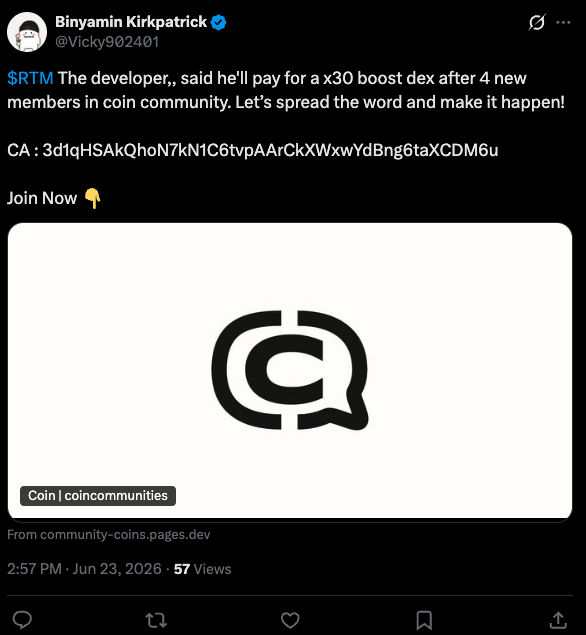
The catch is the timing. The promotion we can see does not precede the rise, it follows it. RTM flipped on June 21 at 02:00 UTC; the earliest X post we found is June 23, more than two days later. SHIBU's wallet surge ran June 24 from 07:00 to 09:00 UTC; its promo cluster lands that evening, roughly twelve hours after the move. So the visible tweets are the victory lap, not the starting gun.
That points the finger at the part the tweets name directly: a paid DEX boost. A purchased trending placement flips a parked token onto bot scanners in minutes, the wallets pour in, and the social spam follows once the chart is visibly green. The on-chain flip and the paid boost line up; the organic-looking tweets do not. You can re-run the social check yourself: search the contract address on X for RTM or SHIBU , then compare the post timestamps against the flip hour.
Every figure ran through Bitquery's trading data
New-wallet-per-hour reconstruction, flip-hour detection, dormancy measurement, wash-signature screening across 339 tokens, and the winners-versus-duds comparison. All from multi-chain DEX trade data with USD values, queried in plain English through Bitquery MCP.
08 · Screen it yourselfOne prompt, three checks
You do not need anything exotic. Point your client at Bitquery MCP and ask:
Find Solana tokens from the last 5 days that traded with under 25 wallets and almost no volume for hours, then suddenly got 200+ brand-new wallets in a single hour. Show each token's symbol, mint, how long it stayed quiet, and the wallet and volume jump in that hour.
To screen a token you already suspect, just ask for an hour-by-hour timeline of trades, unique traders, new wallets, and volume for that mint. Under the hood the logic is three checks.
For anyone building screeners, trending lists, or trading bots, the takeaway is an awkward one. The volume number is the easiest signal to fake and the least predictive of what happens next. The wallet-formation curve, how many genuinely new addresses appear and how suddenly, is far harder to fake and far more honest. A token that grows from 5 to 50 to 300 wallets over a few hours is behaving like a market. A token that jumps from 2 to 2,668 wallets in one hour after three days of silence is running a campaign.
This is not financial advice. This article is provided for informational and educational purposes only and reflects analysis of publicly available on-chain data as of the dates indicated. It does not constitute legal, financial, compliance, tax, or investment advice, and nothing in it is a recommendation, solicitation, or offer to buy, sell, or hold any token or to adopt any trading or token-launch strategy.
The findings characterize on-chain transaction patterns and inferences drawn from them. They are not assertions that any specific person or entity engaged in unlawful conduct, and should not be read as accusations of criminal or regulatory wrongdoing. Token names and contract addresses are referenced solely to make the on-chain analysis reproducible. The external triggers behind each flip (trending placement, promotion, listing) are inferred from the on-chain pattern, not directly observed; on-chain data shows the activation, not its cause.
On-chain figures (wallet counts, volumes, and timestamps) were reconstructed from DEX trade data over a five-day window and may be incomplete or subject to revision as additional data becomes available. Memecoins and micro-cap tokens are extremely high risk, and most participants in such tokens lose money.
Readers should conduct their own independent verification before taking any action. The authors and publisher accept no liability for any loss or damage arising from reliance on this material. All trademarks and product names are the property of their respective owners.
Check the next 'high-volume' token before you trust it
The data that exposes a staged pump is the same data that powers a real screener. Pull any token's new-wallet curve, find its flip hour, and look at what came before it, in plain English, in real time, across eight chains.