We followed 12,426 Uniswap v3 positions from deposit to exit. The median one earned nothing
Providing liquidity on Uniswap v3 is sold as a yield. We matched every deposit to its withdrawal on Ethereum's busiest pools for a full quarter, valued each one in dollars, and compared it with the laziest play there is: buying both tokens and doing nothing. The crowd broke even. The machines did not.
- 91%
- 90%
- 642%
- 67%
- 79%
01 · The betWhat a liquidity provider is promised, and what we measured
The pitch is simple. Deposit two tokens into a pool. Every swap in the pool pays you a fee. Since v3 arrived the pitch has a second half. Put your dollars in a narrow price range and the fees multiply. The catch is called impermanent loss. Every LP page keeps it in small print below the APR.
We checked the pitch against the chain. Bitquery indexes every Ethereum block, so we followed each position on the eight busiest Uniswap v3 pools from the moment it was placed to the moment it was pulled, valued both ends in dollars, split fee income from price effect, and compared the result with doing nothing. Doing nothing means buying both tokens and holding them. An LP the market beats that way has a hobby, and a costly one.
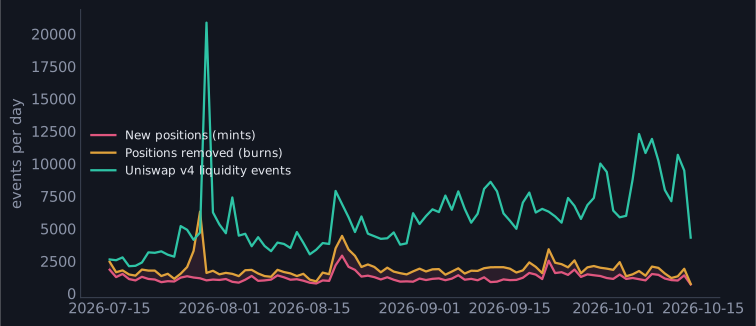
The pools themselves set the mood before any return is counted. More money left these pools than arrived, every single day of the window. The event record shows exits tracking removals almost one for one, so the money that leaves is real money, and Uniswap v4 ran close to six times more liquidity events than v3 over the same days. v3 is not being left behind. Mint activity actually rose through the window. It has stopped growing, and its deposits are being cashed out.
02 · A coin flip, minus the funWhere a range sits decides most of its fate
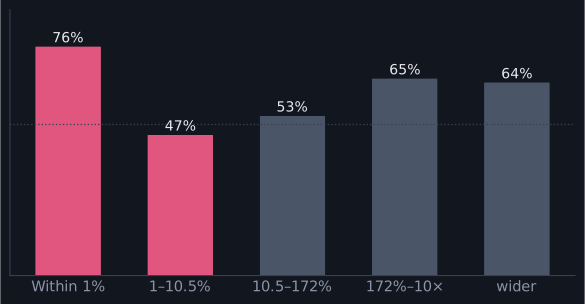
A shade over half the closed deposits ended ahead of doing nothing, and the middle one earned a rounding error. The fee pot was real, and the wins exist. They go elsewhere than the middle of the field, and the first thing that decides where a deposit lands is the width of its price range.
Within a percent of the current price, the win rate is the highest in the data. It is also a game no person can play: those deposits live about six minutes. They are just-in-time liquidity, JIT for short. Bots place them in the same block as a big trade and pull them once the trade is done. For a few minutes the bot is the liquidity, and it wins without collecting anything worth calling a fee. By the time a human tx confirms, the trade that paid for the range is gone.
At the other end, wide ranges win about two in three. They earn less per dollar, and they survive. The middle is the trap. Ranges between one and ten percent of price had the worst win rate of any group, worse than the tight bot ranges and worse than the wide patient ones. That band carries enough exposure to eat a loss to price drift, and not enough width to wait the move out. It is also where a lot of human money sits. It feels like a safe middle ground.
Full range, the v2-style set-and-forget deposit, is close to extinct. Almost nobody supplies liquidity the old way anymore.
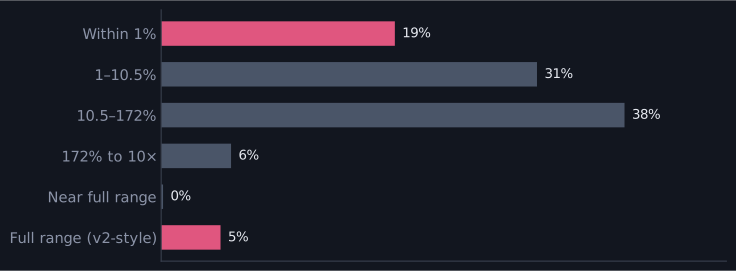
Who those concentrators are decides everything else.
03 · Who actually winsA sandwich bot, three other addresses, and everyone else
The pools record the contract that placed each deposit, and that split tells the story before any return does. Three quarters of mints arrive through the NonfungiblePositionManager, the standard path a human uses. The rest come from contracts acting on their own. One of them is the successor of jaredfromsubway.eth, the sandwich bot made famous for front-running memecoin traders. EigenPhi's write-up traces the lineage. It placed thousands of direct mints, second only to the retail path itself.
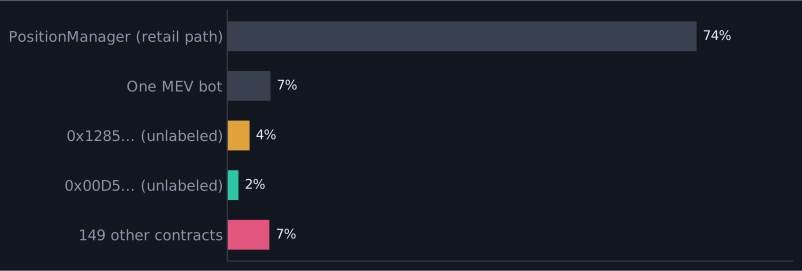
The bot's deposits won nine times in ten. The median win was pocket money on a six-figure deposit. It held for minutes and paid less than a dollar of fees. Its profit held almost no fee income. That is the tell. This is a trader parking stock inside its own sandwich route and pulling it out before anyone else can touch it. On these pools, supplying LP and sandwich attacking have merged into one activity.
Around the bot, the size ladder is steep. The smallest deposits win rarely. The largest win often. The rung between is a coin flip. Part of that gap is gas. It eats a serious share of a small deposit before the price moves at all. Part of it is placement: contracts that call the pools directly land their ranges within a few hundredths of a percent of price. Ranges on the retail path scatter ten times wider. Standing in the right spot is a skill, and it travels with wallet size.
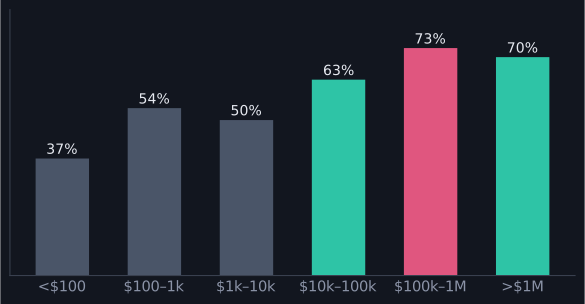
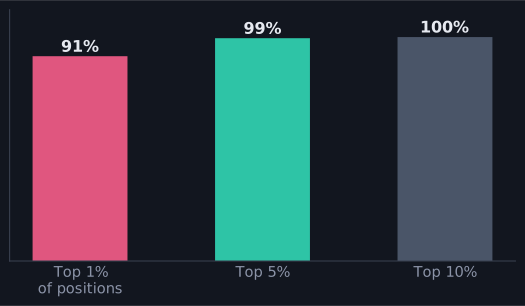
And the ceiling of the whole market looks like this:
04 · The APR is the baitThe top-paying pool was the worst one to be in
Every LP page ranks pools by fee APR. WPRL/USDT, one of the busiest new pairs of the quarter, paid the top realized APR in the sample by far. It also sent four of every five of its providers home worse than plain holding. The left panel shows why: the token rose more than fourfold over the window, and a provider on a rising token keeps selling the rising side of the pool. Every LP in that pool was short the pump. The market charged them for it.
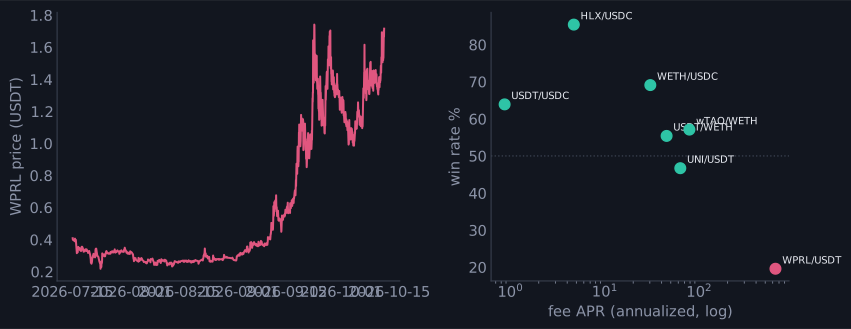
This is the plain version of impermanent loss. Supplying liquidity is a bet that price goes sideways. Get a trend instead, and no fee rate saves you. The pools that treat their LPs best are the boring ones. Price crosses the middle a hundred times, and everyone gets paid for standing there. You can query all of these pools yourself through the DEX data API.
| Pool | How its providers fared, 91 days |
|---|---|
| HLX/USDC | The friendliest pool. 85% of positions beat holding; the token oscillated and paid the middle. Fee APR: 4.7%. |
| WETH/USDC (both fee tiers) | The blue chips. About 69% beat holding, on the deepest deposits in the sample. Fee APR: 30%. |
| USDT/WETH | The whale pool. 55% beat holding, with a net positive total carried by a handful of large deposits. Fee APR: 45%. |
| USDT/USDC | The stable pair. Two in three beat holding, but the pot is thin. Fee APR: under 1%. |
| WPRL/USDT | The casino. One position in five beat holding on a 642% fee APR. The token rose fourfold. |
| UNI/USDT | The grinder. Under half beat holding. Fee APR: 63%. |
05 · The treadmillA range has the shelf life of a loaf of bread
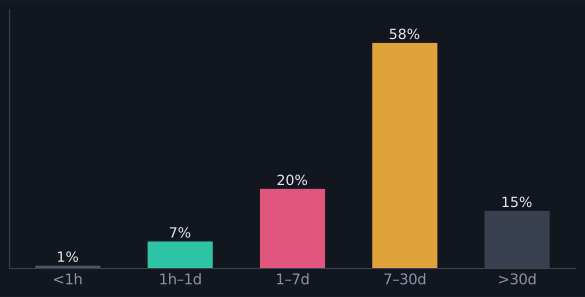
A Uniswap v3 range is perishable. Counting only ranges that started in play, two of every three were fully crossed by price within a week of deposit. The professional answer is to redeploy. One range in our data was re-minted hundreds of times by the same contract, chasing the price as it moved. Most people do not do that. When a typical retail position gets blown out, its owner takes the hit and leaves. Barely one removal in six sees the same range come back within two days.
The fee income then flows to whoever stayed. The JIT crowd, holding an hour or less, took a rounding error of all fees. Depositors who held one to four weeks took most of the pot. The giant APR a page can print from a six-minute hold is a printing error. The durable income on these pools runs around a fifth to a third per year for people who hold weeks, and it comes attached to a job: three of four ranges need care inside a week.
06 · So what worksWide, patient, boring, and small expectations
Within this data, the best human-sized profile was exactly that. A range wider than about a twofold price move, on a major pair, held one to four weeks, won four times in five. The median return per position is small. On the biggest pool it won almost nine in ten. Nobody gets rich on those numbers. They beat the coin flip, and they survive the week, and a grinder who repeats the cycle earns something close to the durable fee income of the patient.
Every cut we ran points the same way. Narrow wins only for machines. The middle loses. Wide and patient grinds out a small edge. And the profit pool belongs to a handful of addresses that treat liquidity as stock. Everyone else pays for the option to feel like a market maker.
Ask these questions in plain English
Every position, fee and price in this story comes from Bitquery's Ethereum data. The Bitquery MCP server puts that data behind an AI assistant, so you can ask how a pool's liquidity moved, who called mint on it, or what a wallet has been doing, without writing the query yourself.
Positions were matched per pool, caller and tick range, and closed when burned liquidity reached minted liquidity. Positions placed through the standard manager share one address, so several people's deposits at the same range can be counted as one position. Address-level figures are unaffected; per-position sizes for the retail path are upper bounds.
Returns compare the value collected at exit with holding both tokens from deposit to exit, valued at hourly trade prices. USDC and USDT are held at one dollar. Gas costs are estimated, not measured, and excluded from returns. 3,357 positions still open at the end of the window are excluded from all return figures.
The bot we call the jaredfromsubway.eth successor is known only by its address and behavior on the chain. Its intent in minting pool ranges is inferred from timing and placement, and is not stated by its owner anywhere we found.
Fee APR figures scale fees by capital deployed and time held. Pools dominated by positions held for minutes print annualized rates that no patient depositor earns.
This article is provided for informational and educational purposes only and reflects analysis of publicly available on-chain data as of the dates indicated. It does not constitute legal, financial, compliance, or investment advice, and nothing in it is a recommendation to buy, sell, or hold any token or asset, or to provide liquidity on any protocol.
The findings describe positions, fees and price movements observed on Ethereum between 15 July and 13 October 2026. Return comparisons depend on the holding benchmark, the hourly prices used and the position-matching method, and may be incomplete or revised as more data becomes available. Blockchain addresses are pseudonymous, and an address calling a pool contract does not by itself establish the identity, intent, or knowledge of any party.
References to Uniswap, the NonfungiblePositionManager, or any other named protocol or project describe what the record shows about addresses and transactions linked to them. They are not statements about any party's security practices, solvency or conduct, and nothing here asserts that any party acted unlawfully or negligently. The address we call a sandwich bot is known by its behavior alone and attributed to nobody.
Nothing herein should be relied upon as a definitive determination of fact. Readers should conduct their own independent verification before taking any action. The authors and publisher accept no liability for any loss or damage arising from reliance on this material. All trademarks and company names are the property of their respective owners.
Reported by Gaurav Agarwal for Bitquery Research, with AI tools; every figure was checked against the raw data.