We tracked 170,569 Uniswap v4 liquidity positions for a full quarter, next to the v3 record. The depth you see is not the depth you get
Uniswap v4 moved every pool into one contract and let anyone attach code to a pool. Over one quarter we measured what liquidity providers actually do on it, and compared each cut against the v3 record from our earlier study. The add counts exploded. The ranges went wide where the retail path goes and tight where machines go. And the biggest pool's visible depth turned out to be a thin film that turns over hundreds of times per day.
- 308×
- 3.5×
- 100%
- 5.4 min
- 18
01 · The betWhat v4 changed, and what we could honestly measure
Version four promised cheaper routing, pools with their own rules, and fees that move with the market. Twenty months later, the machines have had their run at it. This study asks what they built.
Our earlier v3 study followed each deposit to its exit and valued it in dollars. On v4 that last step cannot be done cleanly yet, because the protocol stopped splitting fee accounting the way v3 did. So this study measures behavior only, on both versions over the same window. How much gets placed. How wide, by whom, and for how long. And how much of it stands in the way of trades. Every claim comes from the raw event record on Ethereum, matched add to add.
One note before the numbers. A quarter of v4's raw liquidity events move no liquidity at all; the retail manager emits most of these zero-size calls during its own housekeeping. We count them where they matter and drop them where they would lie.
02 · Two curvesv4 compounds while v3 drains
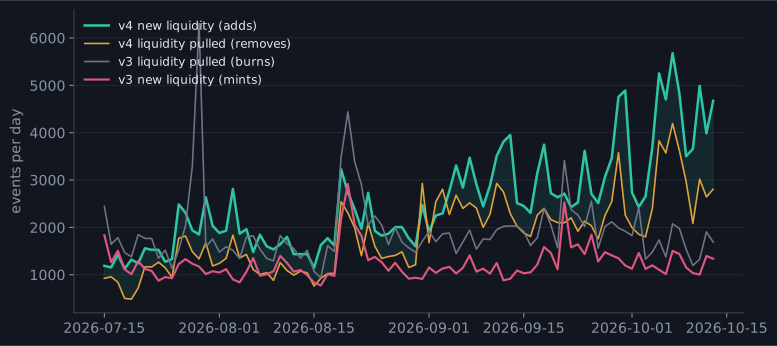
The counts tell a clean story. v4 opened the window level with v3, near 1,300 adds per day, and ended it three and a half times larger. The curve was still rising at the end. v3 mints went nowhere across the same days.
The direction of flow separates the versions even more sharply than the level. v4 added more than it removed on 88 of the window's 91 days. v3 drained on all 91 of them. One book compounds. The other pays out.
03 · The shape of a rangeRetail goes wide on v4, machines go tight
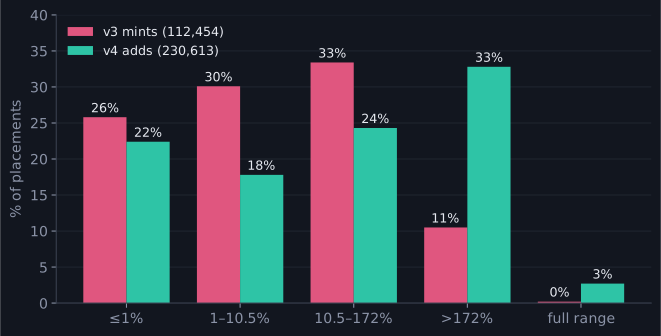
Where a provider sets the edges of its range decides its fate. On v3 the middle bands carry the crowd, and our v3 study found that seat to be the worst in the house. On v4 the middle empties out and the weight shifts to the two edges instead.
The retail path drives the shift. Adds through v4's retail manager, the standard wallet route, skew wide, and full-range v2-style deposits came back from the dead, far more common than on v3. Cheap gas and a single shared home for all pools make laziness affordable again. Machines that call the pools directly move the opposite way. Three in ten of their adds sit within one percent of price. Another three in ten sit just above it. Machines kept the tight game and gave the wide game to everyone else.
04 · Six minutesThe just-in-time game moved over and got faster
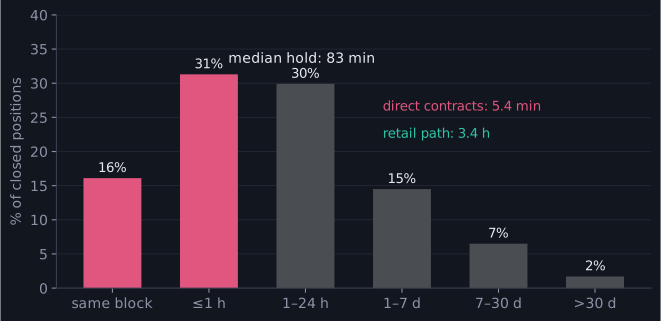
Match each v4 add to the event that closes it and the clock appears. The full count of position keys, and how many closed inside the window, sits in the chart below. Half of the closed ones lived under an hour and a half. One in six closed in the block it opened in. Machines placing it directly, the non-retail path, hold a median of five minutes, and four in ten of their ranges open and close inside a single block.
Compare that with v3, where the tightest band held six minutes and the machines behind it were the study's winners. The move did not soften the game. The tightest v4 ranges again show a median hold in the five-minute range, and they are one fifth of all closed ranges.
Churn completes the picture. Most v4 keys are placed exactly once and never topped up. At the other end, a handful of keys were re-placed more than twenty times each, and one key absorbed more adds than any v3 key we measured. A small set of machines treats one spot in one pool as a pump that gets restocked hundreds of times.
05 · Who places itOne manager, one farm, and a crowd of single-pool bots
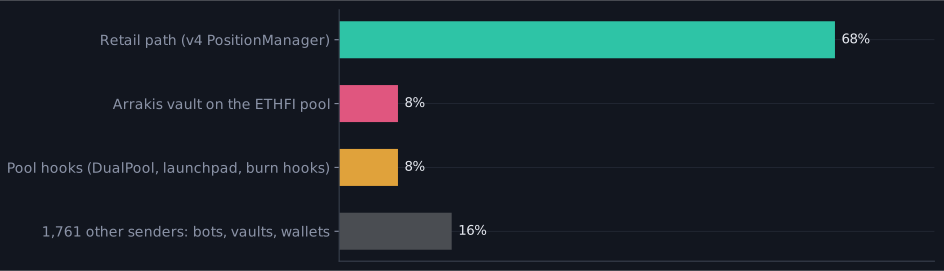
The sender record splits v4's book into a retail flow and a machine flow, as on v3. The retail manager places most of it. Below that line, v4's machine story has a new shape, and the strangest part is who the machines are. On v3 the big direct placers were bots and unlabeled contracts. On v4, most of the biggest ones are the pools' own hooks.
The single biggest machine flow is an Arrakis vault. The ETHFI/ETH pool was created with an Arrakis hook and a dynamic fee. It took more adds than any other v4 pool. Every add came from that one authorized vault. Its ranges sit about ten percent wide, its median hold is six minutes, and the realized fee it farms hovers near a third of a percent. A pro product, pair-farming its own pool around the clock.
Next to it sit the hooks themselves. DualPoolHook, shipped by Uniswap Labs, parks its idle cash in a token-market fund. During a swap it steps into the pool with fresh cash, then steps out. A launch hook seeded pools for over four thousand new tokens this quarter. Its anti-snipe fee starts near ninety-nine percent and falls as a sale settles, set by the hook while the sale runs. Burn hooks rebate fees by adjusting ranges inside other people's trades. Much of the "who" here is the pool's own code, running inside someone else's transaction rather than from any wallet.
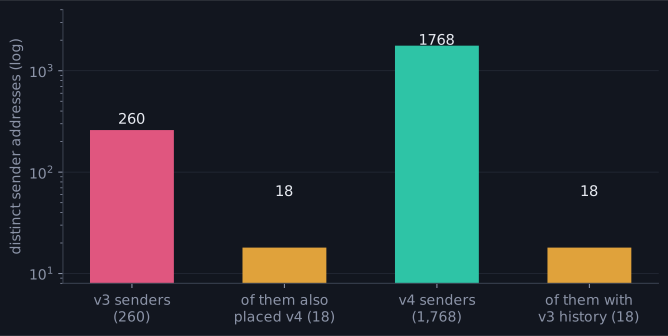
The wallet-level machines are still there, MEV bots from the mevrevolution family among them. And the sender crowd is broader than v3's, not thinner: nearly seven times the addresses placed liquidity on v4 this quarter. The counts sit in the chart.
06 · The hook economyA quarter of pools carry code, and they hold real depth
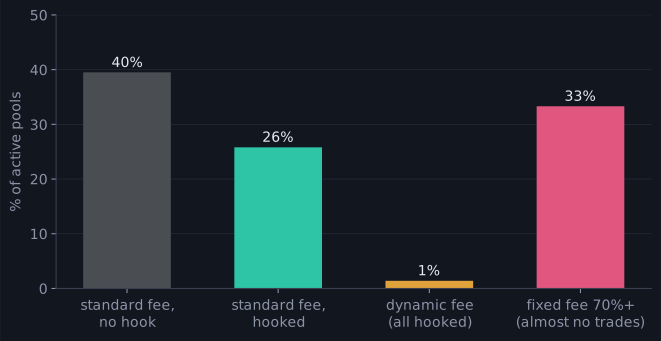
Hooks were v4's headline feature, and the pool record shows them in active use. Roughly a quarter of the pools that got liquidity in the window were born with a hook attached. They took a hair under a third of all events. Dynamic-fee pools, where the fee moves with the market, stay rare, and every one of them is hooked.
The strangest third of the pool list carries fixed fees of seventy percent and up, toll-booth settings no v3 pool could express. Those pools are born without hooks, and they barely trade: a fifth of a percent of all v4 swaps. They are a creation artifact, a wave of pools stamped out at 95 and 99 percent fees that almost nobody touched again. The v4 pool count swells on paper because of them.
Hooks also place a large share of it themselves, as the last section showed. The interesting split is what they do to resting depth, which the next section measures. The short version: hook-less pools hold the fastest, thinnest liquidity on v4. The big hooked pools act more like v3's book, with real dollars standing near price. The hook economy is where v4's design bet is paying off.
07 · The depth illusionThe book you trade against is thinner than it looks
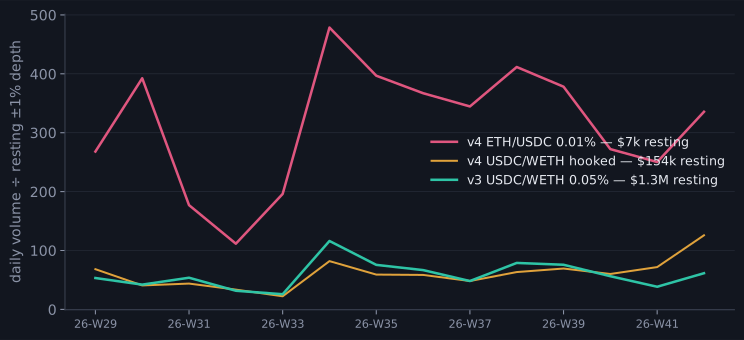
Every v4 swap event records how much liquidity was standing at the price it executed against. That field lets us do something v3's raw record could not, weigh the swaps against the resting book directly. We took each day's trade volume on a pool. Then we divided it by the dollars resting within one percent of price, the band that absorbs a trade.
The flagship numbers sit in the chart. On v4's busiest pool, a hair-thin film carries a hundred times its own size in daily trade, week after week. v3's flagship pool on the same pair rests a far heavier book and turns over gently. The big hooked v4 pool lands in between, with real dollars standing near price.
Read the three lines together and v4's design lands differently than its launch notes. The top hook-less pools run on liquidity that is placed, used, and pulled within minutes. What a trader sees as depth is a film the bots rebuild between blocks. The pools that hold real standing depth on v4 are the hooked ones, where someone is being paid to stay. You can pull the same events yourself through the DEX data API.
| Book | What stands in it, 91 days |
|---|---|
| v4 ETH/USDC 0.01% | The fastest book. $2.4M median daily volume on $7k resting within 1% of price. 308 turns per day. $35M placed all quarter. |
| v4 USDC/USDT | The stable workhorse. $202M placed, the most capital of any major v4 pool, spread across hooked and hook-less tiers. |
| v4 hooked USDC/WETH | The design paying off. $154k standing near price, 56 turns per day, dynamic fee. Real depth, v3-like behavior. |
| v3 USDC/WETH 0.05% | The old flagship. $1.3M standing within 1%, 54 turns per day, $66M daily volume. Still the deepest book on either version. |
| v4 ETHFI/ETH hooked | The farm. One Arrakis vault, 21,470 adds, ten percent wide, six minutes each, fee near 0.3%. |
08 · The shock testVolatility still goes to v3
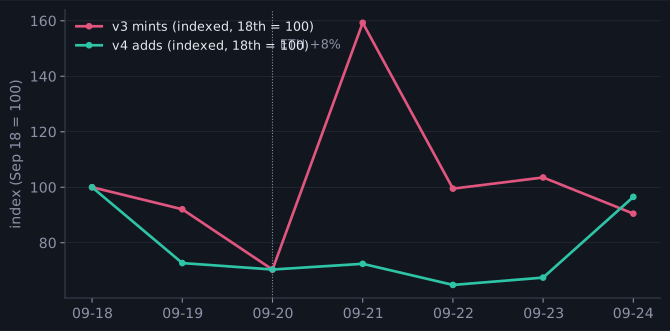
On Sep 21, ETH moved about eight percent in a day. Our v3 study watched minting more than double in response, as machines and people rushed to reprice their ranges. That day is a natural experiment, so we ran both books through it.
v3 responded exactly as before, with a spike of more than double on the day itself. v4's add flow barely moved day to day, and had been sagging all week. The book that compounds weekly is not the one that absorbs a shock. When price lurches, the activity still floods into v3's pools, and v4's machines carry on with their schedule. Depth on demand remains a v3 service. v4 supplies it on a clock.
09 · New moneyAlmost nobody moved
The migration question has a clean answer, and the answer is no. Of the few hundred senders that placed v3 liquidity in the window, the ones that also placed v4 number fewer than twenty. The counts sit in the chart. Almost none of v3's pro cohort followed their own money over. The sandwich bot that dominated v3's direct adds never touched v4 in the window at all. It farms the old book and sees no reason to move.
The few that run both sides at once, and every one of them runs a bigger operation on v4 than the v3 business it kept. The rest of v4's senders are new addresses with no v3 past at all. v4 recruited a different crowd, leaner, more automated, and built around single pools.
10 · So whatTwo markets, one brand
Put the two studies side by side and the picture is coherent. v3 is where the shock absorbers live, humans and sandwich machinery around a deep, patient core, still the place volatility goes to get priced. v4 is where the growth is, and the growth is mechanical. Add counts compound weekly. Ranges sit at the two poles of wide and hair-trigger. A vault pair-farms its own hooked pool. And a top book's visible depth is a six-minute film.
Hooks carry a quarter of pools, and the big hooked ones hold real depth. That is the one place v4's book acts like an upgrade rather than a machine. But the headline growth numbers describe a liquidity class that was never resting liquidity at all. When you next read that v4 runs five times v3's liquidity events, hold the number up to this light. An add that lives six minutes is a booking. The book behind it is thinner than it looks.
Ask these questions in plain English
Every add, pool and swap in this story comes from Bitquery's Ethereum data. The Bitquery MCP server puts that data behind an AI assistant, so you can ask how a pool's liquidity moved, which contract farms it, or how long positions stood, without writing the query yourself.
v4 liquidity events were matched per pool, sender, tick range and salt, and a position was counted closed when cumulative decreases reached 99.9% of cumulative increases. Positions opened before the window and only drained inside it remain in the open count. A key that closes and is later re-used is counted once. The 140,408 events carrying a zero liquidity delta are counted in event totals and excluded from position matching.
This study measures add behavior, not position returns. v4 does not emit the fee record v3 does. Per-position profit cannot be computed the same way, so no return comparison with the v3 study is made here. Dollar figures for resting depth convert the swap event's liquidity field at the price of the hour and describe the band within one percent of price only.
Dollar values of adds are estimated from hourly prices at add time and cover seven major pools, not all of v4. They exclude pools whose tokens could not be valued and treat native ETH and WETH as equal. Zero-delta events emitted by the position manager are treated as housekeeping; their purpose is inferred from the record, not documented by the protocol.
Sender counts treat the retail manager as one sender, so thousands of wallet users appear as a single address. Contract labels mix behavior with external identification: the Arrakis vault and DualPoolHook are identified from verified contract code and Uniswap's own hook registry, while other senders are known only by their addresses and activity.
This article is provided for informational and educational purposes only and reflects analysis of publicly available on-chain data as of the dates indicated. It does not constitute legal, financial, compliance, or investment advice, and nothing in it is a recommendation to buy, sell, or hold any token or asset, or to provide liquidity on any protocol.
The findings describe liquidity adds, holding times, pool settings and swap activity observed on Ethereum between 15 July and 13 October 2026. Behavioral labels such as farm, bot and resting depth depend on the matching method and the definitions used, and may be incomplete or revised as more data becomes available. Blockchain addresses are pseudonymous, and an address calling a pool contract does not by itself establish the identity, intent, or knowledge of any party.
References to Uniswap, the position managers, hooks, or any other named protocol or project describe what the record shows about addresses and transactions linked to them. They are not statements about any party's security practices, solvency or conduct, and nothing here asserts that any party acted unlawfully or negligently.
Nothing herein should be relied upon as a definitive determination of fact. Readers should conduct their own independent verification before taking any action. The authors and publisher accept no liability for any loss or damage arising from reliance on this material. All trademarks and company names are the property of their respective owners.
Reported by Gaurav Agarwal for Bitquery Research, with AI tools; every figure was checked against the raw data.